

Socio-Economic Impact of HIV and AIDS in Tamil nadu
Socio-Economic Impact of HIV and AIDS in Tamil nadu
Socio-Economic Impact of HIV and AIDS in Tamil nadu

Create successful ePaper yourself
Turn your PDF publications into a flip-book with our unique Google optimized e-Paper software.
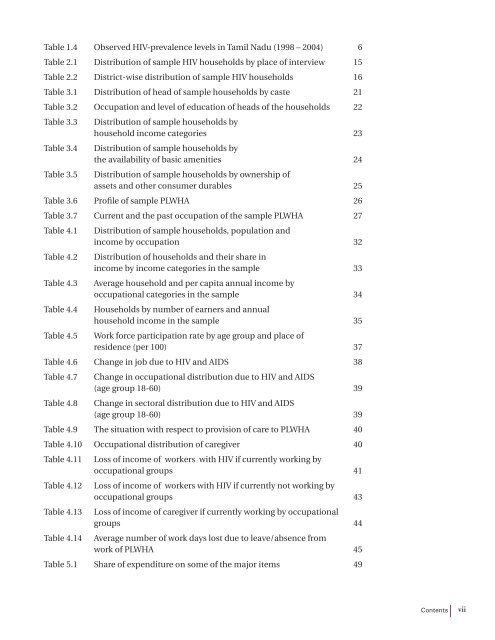
Table 1.4 Observed <strong>HIV</strong>-prevalence levels <strong>in</strong> <strong>Tamil</strong> Nadu (1998 – 2004) 6<br />
Table 2.1 Distribution <strong>of</strong> sample <strong>HIV</strong> households by place <strong>of</strong> <strong>in</strong>terview 15<br />
Table 2.2 District-wise distribution <strong>of</strong> sample <strong>HIV</strong> households 16<br />
Table 3.1 Distribution <strong>of</strong> head <strong>of</strong> sample households by caste 21<br />
Table 3.2 Occupation <strong>and</strong> level <strong>of</strong> education <strong>of</strong> heads <strong>of</strong> the households 22<br />
Table 3.3<br />
Table 3.4<br />
Table 3.5<br />
Distribution <strong>of</strong> sample households by<br />
household <strong>in</strong>come categories 23<br />
Distribution <strong>of</strong> sample households by<br />
the availability <strong>of</strong> basic amenities 24<br />
Distribution <strong>of</strong> sample households by ownership <strong>of</strong><br />
assets <strong>and</strong> other consumer durables 25<br />
Table 3.6 Pr<strong>of</strong>ile <strong>of</strong> sample PLWHA 26<br />
Table 3.7 Current <strong>and</strong> the past occupation <strong>of</strong> the sample PLWHA 27<br />
Table 4.1<br />
Table 4.2<br />
Table 4.3<br />
Table 4.4<br />
Table 4.5<br />
Distribution <strong>of</strong> sample households, population <strong>and</strong><br />
<strong>in</strong>come by occupation 32<br />
Distribution <strong>of</strong> households <strong>and</strong> their share <strong>in</strong><br />
<strong>in</strong>come by <strong>in</strong>come categories <strong>in</strong> the sample 33<br />
Average household <strong>and</strong> per capita annual <strong>in</strong>come by<br />
occupational categories <strong>in</strong> the sample 34<br />
Households by number <strong>of</strong> earners <strong>and</strong> annual<br />
household <strong>in</strong>come <strong>in</strong> the sample 35<br />
Work force participation rate by age group <strong>and</strong> place <strong>of</strong><br />
residence (per 100) 37<br />
Table 4.6 Change <strong>in</strong> job due to <strong>HIV</strong> <strong>and</strong> <strong>AIDS</strong> 38<br />
Table 4.7<br />
Table 4.8<br />
Change <strong>in</strong> occupational distribution due to <strong>HIV</strong> <strong>and</strong> <strong>AIDS</strong><br />
(age group 18-60) 39<br />
Change <strong>in</strong> sectoral distribution due to <strong>HIV</strong> <strong>and</strong> <strong>AIDS</strong><br />
(age group 18-60) 39<br />
Table 4.9 The situation with respect to provision <strong>of</strong> care to PLWHA 40<br />
Table 4.10 Occupational distribution <strong>of</strong> caregiver 40<br />
Table 4.11<br />
Table 4.12<br />
Table 4.13<br />
Table 4.14<br />
Loss <strong>of</strong> <strong>in</strong>come <strong>of</strong> workers with <strong>HIV</strong> if currently work<strong>in</strong>g by<br />
occupational groups 41<br />
Loss <strong>of</strong> <strong>in</strong>come <strong>of</strong> workers with <strong>HIV</strong> if currently not work<strong>in</strong>g by<br />
occupational groups 43<br />
Loss <strong>of</strong> <strong>in</strong>come <strong>of</strong> caregiver if currently work<strong>in</strong>g by occupational<br />
groups 44<br />
Average number <strong>of</strong> work days lost due to leave/absence from<br />
work <strong>of</strong> PLWHA 45<br />
Table 5.1 Share <strong>of</strong> expenditure on some <strong>of</strong> the major items 49<br />
Contents<br />
vii


