

Socio-Economic Impact of HIV and AIDS in Tamil nadu
Socio-Economic Impact of HIV and AIDS in Tamil nadu
Socio-Economic Impact of HIV and AIDS in Tamil nadu

You also want an ePaper? Increase the reach of your titles
YUMPU automatically turns print PDFs into web optimized ePapers that Google loves.
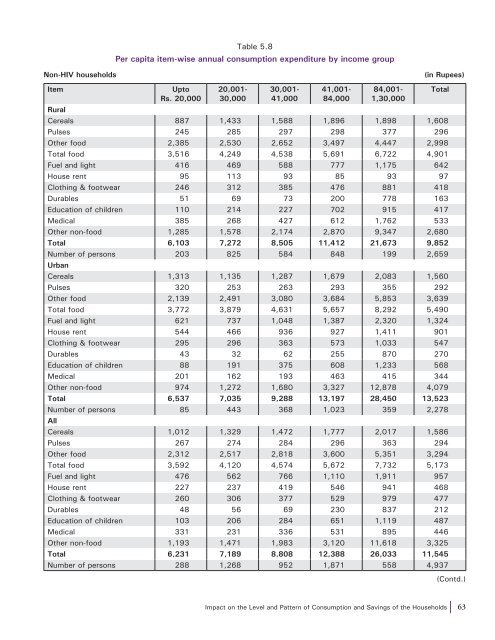
Table 5.8<br />
Per capita item-wise annual consumption expenditure by <strong>in</strong>come group<br />
Non-<strong>HIV</strong> households<br />
(<strong>in</strong> Rupees)<br />
Item<br />
Upto<br />
Rs. 20,000<br />
20,001-<br />
30,000<br />
30,001-<br />
41,000<br />
41,001-<br />
84,000<br />
84,001-<br />
1,30,000<br />
Rural<br />
Cereals 887 1,433 1,588 1,896 1,898 1,608<br />
Pulses 245 285 297 298 377 296<br />
Other food 2,385 2,530 2,652 3,497 4,447 2,998<br />
Total food 3,516 4,249 4,538 5,691 6,722 4,901<br />
Fuel <strong>and</strong> light 416 469 588 777 1,175 642<br />
House rent 95 113 93 85 93 97<br />
Cloth<strong>in</strong>g & footwear 246 312 385 476 881 418<br />
Durables 51 69 73 200 778 163<br />
Education <strong>of</strong> children 110 214 227 702 915 417<br />
Medical 385 268 427 612 1,762 533<br />
Other non-food 1,285 1,578 2,174 2,870 9,347 2,680<br />
Total 6,103 7,272 8,505 11,412 21,673 9,852<br />
Number <strong>of</strong> persons 203 825 584 848 199 2,659<br />
Urban<br />
Cereals 1,313 1,135 1,287 1,679 2,083 1,560<br />
Pulses 320 253 263 293 355 292<br />
Other food 2,139 2,491 3,080 3,684 5,853 3,639<br />
Total food 3,772 3,879 4,631 5,657 8,292 5,490<br />
Fuel <strong>and</strong> light 621 737 1,048 1,387 2,320 1,324<br />
House rent 544 466 936 927 1,411 901<br />
Cloth<strong>in</strong>g & footwear 295 296 363 573 1,033 547<br />
Durables 43 32 62 255 870 270<br />
Education <strong>of</strong> children 88 191 375 608 1,233 568<br />
Medical 201 162 193 463 415 344<br />
Other non-food 974 1,272 1,680 3,327 12,878 4,079<br />
Total 6,537 7,035 9,288 13,197 28,450 13,523<br />
Number <strong>of</strong> persons 85 443 368 1,023 359 2,278<br />
All<br />
Cereals 1,012 1,329 1,472 1,777 2,017 1,586<br />
Pulses 267 274 284 296 363 294<br />
Other food 2,312 2,517 2,818 3,600 5,351 3,294<br />
Total food 3,592 4,120 4,574 5,672 7,732 5,173<br />
Fuel <strong>and</strong> light 476 562 766 1,110 1,911 957<br />
House rent 227 237 419 546 941 468<br />
Cloth<strong>in</strong>g & footwear 260 306 377 529 979 477<br />
Durables 48 56 69 230 837 212<br />
Education <strong>of</strong> children 103 206 284 651 1,119 487<br />
Medical 331 231 336 531 895 446<br />
Other non-food 1,193 1,471 1,983 3,120 11,618 3,325<br />
Total 6,231 7,189 8,808 12,388 26,033 11,545<br />
Number <strong>of</strong> persons 288 1,268 952 1,871 558 4,937<br />
Total<br />
(Contd.)<br />
<strong>Impact</strong> on the Level <strong>and</strong> Pattern <strong>of</strong> Consumption <strong>and</strong> Sav<strong>in</strong>gs <strong>of</strong> the Households<br />
63


