

Socio-Economic Impact of HIV and AIDS in Tamil nadu
Socio-Economic Impact of HIV and AIDS in Tamil nadu
Socio-Economic Impact of HIV and AIDS in Tamil nadu

You also want an ePaper? Increase the reach of your titles
YUMPU automatically turns print PDFs into web optimized ePapers that Google loves.
households use firewood. Liquified<br />
Petroleum Gas (LPG seems to be the next<br />
popular mode with 29 percent <strong>of</strong> <strong>HIV</strong><br />
<strong>and</strong> 34 percent <strong>of</strong> non-<strong>HIV</strong> households<br />
us<strong>in</strong>g it. Kerosene users form a similar<br />
percentage <strong>in</strong> both <strong>HIV</strong> <strong>and</strong> non-<strong>HIV</strong><br />
households.<br />
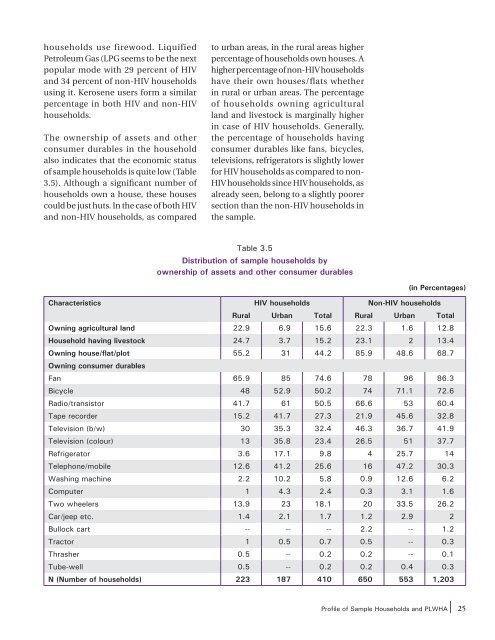
The ownership <strong>of</strong> assets <strong>and</strong> other<br />
consumer durables <strong>in</strong> the household<br />
also <strong>in</strong>dicates that the economic status<br />
<strong>of</strong> sample households is quite low (Table<br />
3.5). Although a significant number <strong>of</strong><br />
households own a house, these houses<br />
could be just huts. In the case <strong>of</strong> both <strong>HIV</strong><br />
<strong>and</strong> non-<strong>HIV</strong> households, as compared<br />
to urban areas, <strong>in</strong> the rural areas higher<br />
percentage <strong>of</strong> households own houses. A<br />
higher percentage <strong>of</strong> non-<strong>HIV</strong> households<br />
have their own houses/flats whether<br />
<strong>in</strong> rural or urban areas. The percentage<br />
<strong>of</strong> households own<strong>in</strong>g agricultural<br />
l<strong>and</strong> <strong>and</strong> livestock is marg<strong>in</strong>ally higher<br />
<strong>in</strong> case <strong>of</strong> <strong>HIV</strong> households. Generally,<br />
the percentage <strong>of</strong> households hav<strong>in</strong>g<br />
consumer durables like fans, bicycles,<br />
televisions, refrigerators is slightly lower<br />
for <strong>HIV</strong> households as compared to non-<br />
<strong>HIV</strong> households s<strong>in</strong>ce <strong>HIV</strong> households, as<br />
already seen, belong to a slightly poorer<br />
section than the non-<strong>HIV</strong> households <strong>in</strong><br />
the sample.<br />
Table 3.5<br />
Distribution <strong>of</strong> sample households by<br />
ownership <strong>of</strong> assets <strong>and</strong> other consumer durables<br />
(<strong>in</strong> Percentages)<br />
Characteristics <strong>HIV</strong> households Non-<strong>HIV</strong> households<br />
Rural Urban Total Rural Urban Total<br />
Own<strong>in</strong>g agricultural l<strong>and</strong> 22.9 6.9 15.6 22.3 1.6 12.8<br />
Household hav<strong>in</strong>g livestock 24.7 3.7 15.2 23.1 2 13.4<br />
Own<strong>in</strong>g house/flat/plot 55.2 31 44.2 85.9 48.6 68.7<br />
Own<strong>in</strong>g consumer durables<br />
Fan 65.9 85 74.6 78 96 86.3<br />
Bicycle 48 52.9 50.2 74 71.1 72.6<br />
Radio/transistor 41.7 61 50.5 66.6 53 60.4<br />
Tape recorder 15.2 41.7 27.3 21.9 45.6 32.8<br />
Television (b/w) 30 35.3 32.4 46.3 36.7 41.9<br />
Television (colour) 13 35.8 23.4 26.5 51 37.7<br />
Refrigerator 3.6 17.1 9.8 4 25.7 14<br />
Telephone/mobile 12.6 41.2 25.6 16 47.2 30.3<br />
Wash<strong>in</strong>g mach<strong>in</strong>e 2.2 10.2 5.8 0.9 12.6 6.2<br />
Computer 1 4.3 2.4 0.3 3.1 1.6<br />
Two wheelers 13.9 23 18.1 20 33.5 26.2<br />
Car/jeep etc. 1.4 2.1 1.7 1.2 2.9 2<br />
Bullock cart -- -- -- 2.2 -- 1.2<br />
Tractor 1 0.5 0.7 0.5 -- 0.3<br />
Thrasher 0.5 -- 0.2 0.2 -- 0.1<br />
Tube-well 0.5 -- 0.2 0.2 0.4 0.3<br />
N (Number <strong>of</strong> households) 223 187 410 650 553 1,203<br />
Pr<strong>of</strong>ile <strong>of</strong> Sample Households <strong>and</strong> PLWHA<br />
25


