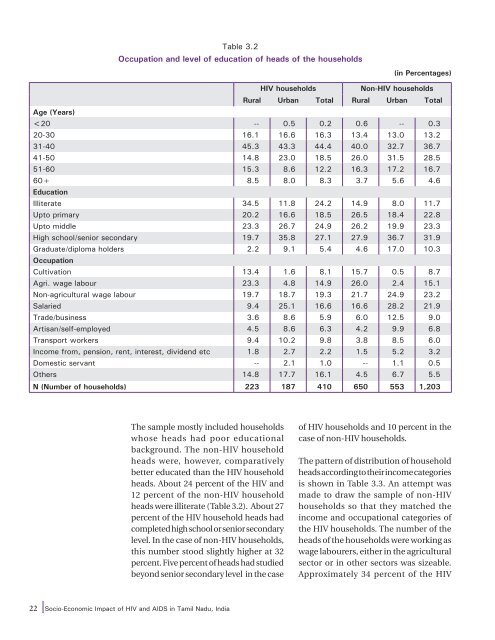
Table 3.2 Occupation <strong>and</strong> level <strong>of</strong> education <strong>of</strong> heads <strong>of</strong> the households (<strong>in</strong> Percentages) <strong>HIV</strong> households Non-<strong>HIV</strong> households Rural Urban Total Rural Urban Total Age (Years)
Table 3.3 Distribution <strong>of</strong> sample households by household <strong>in</strong>come categories (<strong>in</strong> Percentages) Characteristics <strong>HIV</strong> households Non-<strong>HIV</strong> households Rural Urban Total Rural Urban Total Annual HH <strong>in</strong>come (Rs.) 1. Upto 20,000 44.8 20.9 33.9 9.5 4.3 7.2 2. 20,001-30,000 22.9 16 19.8 34.3 21.2 28.3 3. 30,001-41,000 10.8 15 12.7 19.2 16.8 18.1 4. 41,001-84,000 19.3 35.3 26.6 30.3 43 36.2 5. 84,000 & above 2.3 12.8 7.1 6.6 14.7 10.3 Average HH <strong>in</strong>come (Rs.) 29,019 51,556 39,298 41,586 57,450 48,878 household heads <strong>and</strong> 38 percent <strong>of</strong> the non-<strong>HIV</strong> household heads were wage earners. About 17 percent <strong>of</strong> the heads <strong>of</strong> <strong>HIV</strong> households <strong>and</strong> nearly 22 percent <strong>of</strong> non-<strong>HIV</strong> household heads were salary earners. While the distribution accord<strong>in</strong>g to occupational groups was similar between both the households, certa<strong>in</strong> variations <strong>in</strong> the category <strong>of</strong> distribution accord<strong>in</strong>g to <strong>in</strong>come were observed. 3.1.1 <strong>Economic</strong> status <strong>of</strong> the sample households Although an effort was made to draw the sample <strong>of</strong> non-<strong>HIV</strong> households to match the <strong>in</strong>come distribution levels <strong>of</strong> <strong>HIV</strong> households, the two did not work out to be exactly similar. While nearly 34 percent <strong>of</strong> <strong>HIV</strong> households are from the lowest <strong>in</strong>come group <strong>of</strong> less than Rs. 20,000 per annum, only about 7 percent <strong>of</strong> non-<strong>HIV</strong> households belong to this group. While 33 percent <strong>of</strong> <strong>HIV</strong> households are <strong>in</strong> the <strong>in</strong>come range <strong>of</strong> Rs. 20,001 to Rs. 41,000, the non-<strong>HIV</strong> households <strong>in</strong> this range account for 46 percent <strong>of</strong> the sample. Consequently, the percentage <strong>of</strong> households with <strong>in</strong>come above Rs. 41,001 among the non-<strong>HIV</strong> sample is 47 percent while it is only 33 percent among <strong>HIV</strong> households. Because <strong>of</strong> this, it is seen that the average household <strong>in</strong>come <strong>of</strong> <strong>HIV</strong> households is less than that <strong>of</strong> non-<strong>HIV</strong> households <strong>in</strong> all three; rural, urban, <strong>and</strong> total samples. The average household <strong>in</strong>come has worked out to Rs. 48,878 for non-<strong>HIV</strong> households <strong>and</strong> Rs. 39,298 for <strong>HIV</strong> households. Thus, it is clear from the table that most <strong>of</strong> the sample <strong>HIV</strong> households belong to low economic <strong>and</strong> educational strata <strong>of</strong> society. Although there is enough evidence to show that it is the poor people who are more vulnerable to <strong>HIV</strong> <strong>and</strong> <strong>AIDS</strong> (UNDP, 2003), <strong>in</strong> the present sample there are more households from the poor <strong>and</strong> low-<strong>in</strong>come categories due to yet another reason. In spite <strong>of</strong> their best efforts, the field <strong>in</strong>vestigators could not get access to the middle, upper middle class <strong>and</strong> rich households as they drew their sample ma<strong>in</strong>ly from public health facilities <strong>and</strong> NGOs, which mostly cater to poor/low-<strong>in</strong>come households. Generally the middle/rich PLWHA would approach only private health facilities for reasons <strong>of</strong> anonymity. The doctors at a reputed private hospital <strong>in</strong> <strong>Tamil</strong> Nadu corroborated this observation. In an <strong>in</strong>formal discussion with them, it was learnt that PLWHA do visit them for the treatment <strong>of</strong> opportunistic <strong>in</strong>fections but due to reasons <strong>of</strong> confidentiality, the field <strong>in</strong>vestigators could not get access to such persons. The average household <strong>in</strong>come <strong>of</strong> <strong>HIV</strong> households is less than that <strong>of</strong> non-<strong>HIV</strong> households <strong>in</strong> all three; rural, urban, <strong>and</strong> total samples Pr<strong>of</strong>ile <strong>of</strong> Sample Households <strong>and</strong> PLWHA 23