

Socio-Economic Impact of HIV and AIDS in Tamil nadu
Socio-Economic Impact of HIV and AIDS in Tamil nadu
Socio-Economic Impact of HIV and AIDS in Tamil nadu

Create successful ePaper yourself
Turn your PDF publications into a flip-book with our unique Google optimized e-Paper software.
In o rd e r t o s e l e c t t h e n o n - H I V<br />
households (control group), a list<strong>in</strong>g <strong>of</strong><br />
the households <strong>in</strong> the locality/village<br />
was undertaken. In the case <strong>of</strong> rural<br />
areas, if it was a relatively small village,<br />
all the households <strong>in</strong> the village were<br />
listed. In the case <strong>of</strong> a large village, a<br />
sampl<strong>in</strong>g fraction was used <strong>and</strong> every<br />
second or third or fourth household was<br />
listed depend<strong>in</strong>g upon the size <strong>of</strong> the<br />
village. A maximum <strong>of</strong> 150 households<br />
were listed <strong>in</strong> each selected village.<br />
Similarly, <strong>in</strong> urban areas, around 100<br />
households were listed <strong>in</strong> each block.<br />
While select<strong>in</strong>g the sample non-<strong>HIV</strong><br />
households from the list<strong>in</strong>g sheets,<br />
over-sampl<strong>in</strong>g was done to compensate<br />
for non-responses. However, <strong>in</strong> the end<br />
the survey l<strong>and</strong>ed up <strong>in</strong>terview<strong>in</strong>g 1,203<br />
non-<strong>HIV</strong> households i.e. marg<strong>in</strong>ally less<br />
than three times the number <strong>of</strong> <strong>HIV</strong><br />
households <strong>in</strong>terviewed.<br />
In the list<strong>in</strong>g sheets, <strong>in</strong>formation about<br />
the socio-economic characteristics<br />
<strong>of</strong> the households, ma<strong>in</strong>ly <strong>in</strong>come <strong>of</strong><br />
the household <strong>and</strong> occupational <strong>and</strong><br />
educational status <strong>of</strong> the head <strong>of</strong> the<br />
household, was gathered. At the first<br />
step the match<strong>in</strong>g was done on the<br />
basis <strong>of</strong> the broad <strong>in</strong>come category<br />
<strong>of</strong> the household, i.e. the frequency<br />
distribution was <strong>in</strong> terms <strong>of</strong> the <strong>in</strong>come<br />
groups <strong>of</strong> the <strong>HIV</strong> households. At the<br />
second stage, the occupational group <strong>of</strong><br />
the head <strong>of</strong> the household was matched<br />
from with<strong>in</strong> each <strong>in</strong>come category. It was<br />
difficult to take this to the next stage <strong>of</strong><br />
match<strong>in</strong>g the level <strong>of</strong> education <strong>of</strong> the<br />
head <strong>of</strong> the household <strong>and</strong> hence, this<br />
variable was ignored. However, s<strong>in</strong>ce<br />
<strong>in</strong>come <strong>and</strong> education are generally<br />
seen to be highly correlated, it was<br />
assumed that this might not create very<br />
serious problems. The respondents from<br />
non-<strong>HIV</strong> households were adult males<br />
or females <strong>in</strong> the age group <strong>of</strong> 20-60<br />
years s<strong>in</strong>ce questions on knowledge<br />
<strong>and</strong> awareness about <strong>HIV</strong> <strong>and</strong> <strong>AIDS</strong><br />
could be answered only by this group.<br />
Accord<strong>in</strong>gly, any household that did not<br />
have a member <strong>in</strong> this age group was not<br />
selected for the survey.<br />
2.1.4 Household questionnaire<br />
The household survey was conducted<br />
us<strong>in</strong>g a structured <strong>in</strong>terview schedule.<br />
Both <strong>HIV</strong> <strong>and</strong> non-<strong>HIV</strong> questionnaires<br />
gathered basic <strong>in</strong>formation like socioeconomic<br />
characteristics <strong>of</strong> all the<br />
household members, household <strong>in</strong>come<br />
<strong>and</strong> expenditure, prevalence <strong>of</strong> morbidity,<br />
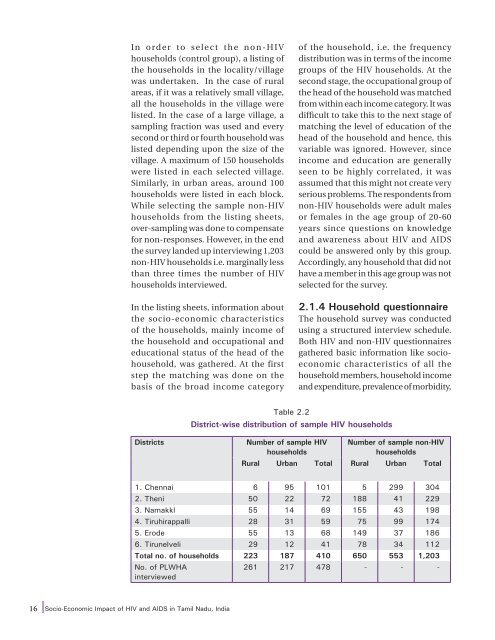
Table 2.2<br />
District-wise distribution <strong>of</strong> sample <strong>HIV</strong> households<br />
Districts<br />
Number <strong>of</strong> sample <strong>HIV</strong><br />
households<br />
Number <strong>of</strong> sample non-<strong>HIV</strong><br />
households<br />
Rural Urban Total Rural Urban Total<br />
1. Chennai 6 95 101 5 299 304<br />
2. Theni 50 22 72 188 41 229<br />
3. Namakkl 55 14 69 155 43 198<br />
4. Tiruhirappalli 28 31 59 75 99 174<br />
5. Erode 55 13 68 149 37 186<br />
6. Tirunelveli 29 12 41 78 34 112<br />
Total no. <strong>of</strong> households 223 187 410 650 553 1,203<br />
No. <strong>of</strong> PLWHA<br />
<strong>in</strong>terviewed<br />
261 217 478 - - -<br />
16 <strong>Socio</strong>-<strong>Economic</strong> <strong>Impact</strong> <strong>of</strong> <strong>HIV</strong> <strong>and</strong> <strong>AIDS</strong> <strong>in</strong> <strong>Tamil</strong> Nadu, India


