

Socio-Economic Impact of HIV and AIDS in Tamil nadu
Socio-Economic Impact of HIV and AIDS in Tamil nadu
Socio-Economic Impact of HIV and AIDS in Tamil nadu

Create successful ePaper yourself
Turn your PDF publications into a flip-book with our unique Google optimized e-Paper software.
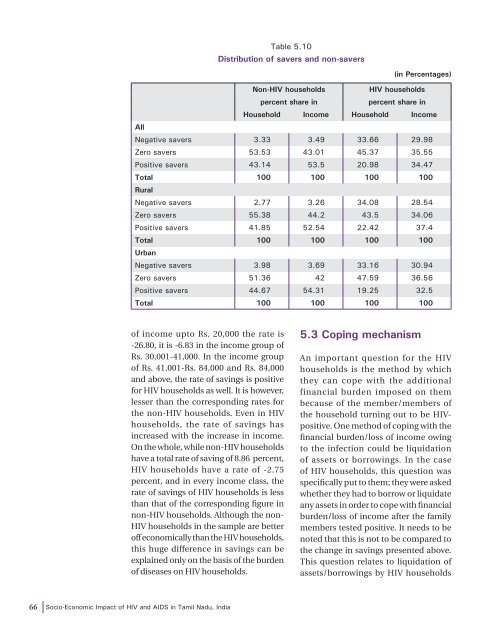
Table 5.10<br />
Distribution <strong>of</strong> savers <strong>and</strong> non-savers<br />
(<strong>in</strong> Percentages)<br />
Non-<strong>HIV</strong> households<br />
<strong>HIV</strong> households<br />
percent share <strong>in</strong><br />
percent share <strong>in</strong><br />
Household Income Household Income<br />
All<br />
Negative savers 3.33 3.49 33.66 29.98<br />
Zero savers 53.53 43.01 45.37 35.55<br />
Positive savers 43.14 53.5 20.98 34.47<br />
Total 100 100 100 100<br />
Rural<br />
Negative savers 2.77 3.26 34.08 28.54<br />
Zero savers 55.38 44.2 43.5 34.06<br />
Positive savers 41.85 52.54 22.42 37.4<br />
Total 100 100 100 100<br />
Urban<br />
Negative savers 3.98 3.69 33.16 30.94<br />
Zero savers 51.36 42 47.59 36.56<br />
Positive savers 44.67 54.31 19.25 32.5<br />
Total 100 100 100 100<br />
<strong>of</strong> <strong>in</strong>come upto Rs. 20,000 the rate is<br />
-26.80, it is -6.83 <strong>in</strong> the <strong>in</strong>come group <strong>of</strong><br />
Rs. 30,001-41,000. In the <strong>in</strong>come group<br />
<strong>of</strong> Rs. 41,001-Rs. 84,000 <strong>and</strong> Rs. 84,000<br />
<strong>and</strong> above, the rate <strong>of</strong> sav<strong>in</strong>gs is positive<br />
for <strong>HIV</strong> households as well. It is however,<br />
lesser than the correspond<strong>in</strong>g rates for<br />
the non-<strong>HIV</strong> households. Even <strong>in</strong> <strong>HIV</strong><br />
households, the rate <strong>of</strong> sav<strong>in</strong>gs has<br />
<strong>in</strong>creased with the <strong>in</strong>crease <strong>in</strong> <strong>in</strong>come.<br />
On the whole, while non-<strong>HIV</strong> households<br />
have a total rate <strong>of</strong> sav<strong>in</strong>g <strong>of</strong> 8.86 percent,<br />
<strong>HIV</strong> households have a rate <strong>of</strong> -2.75<br />
percent, <strong>and</strong> <strong>in</strong> every <strong>in</strong>come class, the<br />
rate <strong>of</strong> sav<strong>in</strong>gs <strong>of</strong> <strong>HIV</strong> households is less<br />
than that <strong>of</strong> the correspond<strong>in</strong>g figure <strong>in</strong><br />
non-<strong>HIV</strong> households. Although the non-<br />
<strong>HIV</strong> households <strong>in</strong> the sample are better<br />
<strong>of</strong>f economically than the <strong>HIV</strong> households,<br />
this huge difference <strong>in</strong> sav<strong>in</strong>gs can be<br />
expla<strong>in</strong>ed only on the basis <strong>of</strong> the burden<br />
<strong>of</strong> diseases on <strong>HIV</strong> households.<br />
5.3 Cop<strong>in</strong>g mechanism<br />
An important question for the <strong>HIV</strong><br />
households is the method by which<br />
they can cope with the additional<br />
f<strong>in</strong>ancial burden imposed on them<br />
because <strong>of</strong> the member/members <strong>of</strong><br />
the household turn<strong>in</strong>g out to be <strong>HIV</strong>positive.<br />
One method <strong>of</strong> cop<strong>in</strong>g with the<br />
f<strong>in</strong>ancial burden/loss <strong>of</strong> <strong>in</strong>come ow<strong>in</strong>g<br />
to the <strong>in</strong>fection could be liquidation<br />
<strong>of</strong> assets or borrow<strong>in</strong>gs. In the case<br />
<strong>of</strong> <strong>HIV</strong> households, this question was<br />
specifically put to them; they were asked<br />
whether they had to borrow or liquidate<br />
any assets <strong>in</strong> order to cope with f<strong>in</strong>ancial<br />
burden/loss <strong>of</strong> <strong>in</strong>come after the family<br />
members tested positive. It needs to be<br />
noted that this is not to be compared to<br />
the change <strong>in</strong> sav<strong>in</strong>gs presented above.<br />
This question relates to liquidation <strong>of</strong><br />
assets/borrow<strong>in</strong>gs by <strong>HIV</strong> households<br />
66 <strong>Socio</strong>-<strong>Economic</strong> <strong>Impact</strong> <strong>of</strong> <strong>HIV</strong> <strong>and</strong> <strong>AIDS</strong> <strong>in</strong> <strong>Tamil</strong> Nadu, India


