

Agricultural Drought Indices - US Department of Agriculture
Agricultural Drought Indices - US Department of Agriculture
Agricultural Drought Indices - US Department of Agriculture

Create successful ePaper yourself
Turn your PDF publications into a flip-book with our unique Google optimized e-Paper software.
Figure 8 shows the combination <strong>of</strong> mean area, mean duration, and mean severity. Similar mean<br />
severities have been reached for different events, but with different combinations <strong>of</strong> mean area<br />
and mean duration. The 1988-1990 drought stands out for this specific drought index and<br />
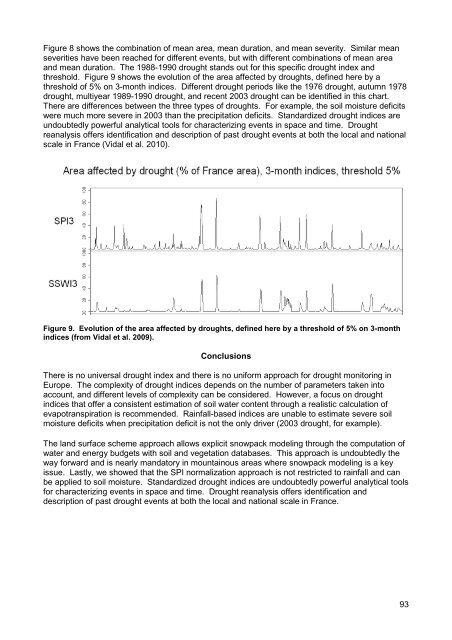
threshold. Figure 9 shows the evolution <strong>of</strong> the area affected by droughts, defined here by a<br />
threshold <strong>of</strong> 5% on 3-month indices. Different drought periods like the 1976 drought, autumn 1978<br />
drought, multiyear 1989-1990 drought, and recent 2003 drought can be identified in this chart.<br />
There are differences between the three types <strong>of</strong> droughts. For example, the soil moisture deficits<br />
were much more severe in 2003 than the precipitation deficits. Standardized drought indices are<br />
undoubtedly powerful analytical tools for characterizing events in space and time. <strong>Drought</strong><br />
reanalysis <strong>of</strong>fers identification and description <strong>of</strong> past drought events at both the local and national<br />
scale in France (Vidal et al. 2010).<br />
Figure 9. Evolution <strong>of</strong> the area affected by droughts, defined here by a threshold <strong>of</strong> 5% on 3-month<br />
indices (from Vidal et al. 2009).<br />
Conclusions<br />
There is no universal drought index and there is no uniform approach for drought monitoring in<br />
Europe. The complexity <strong>of</strong> drought indices depends on the number <strong>of</strong> parameters taken into<br />
account, and different levels <strong>of</strong> complexity can be considered. However, a focus on drought<br />
indices that <strong>of</strong>fer a consistent estimation <strong>of</strong> soil water content through a realistic calculation <strong>of</strong><br />
evapotranspiration is recommended. Rainfall-based indices are unable to estimate severe soil<br />
moisture deficits when precipitation deficit is not the only driver (2003 drought, for example).<br />
The land surface scheme approach allows explicit snowpack modeling through the computation <strong>of</strong><br />
water and energy budgets with soil and vegetation databases. This approach is undoubtedly the<br />
way forward and is nearly mandatory in mountainous areas where snowpack modeling is a key<br />
issue. Lastly, we showed that the SPI normalization approach is not restricted to rainfall and can<br />
be applied to soil moisture. Standardized drought indices are undoubtedly powerful analytical tools<br />
for characterizing events in space and time. <strong>Drought</strong> reanalysis <strong>of</strong>fers identification and<br />
description <strong>of</strong> past drought events at both the local and national scale in France.<br />
93


