

Agricultural Drought Indices - US Department of Agriculture
Agricultural Drought Indices - US Department of Agriculture
Agricultural Drought Indices - US Department of Agriculture

You also want an ePaper? Increase the reach of your titles
YUMPU automatically turns print PDFs into web optimized ePapers that Google loves.
efers to deficiencies in surface and subsurface water supplies, leading to lack <strong>of</strong> water for meeting<br />
normal and specific water demands. <strong>Agricultural</strong> drought is a deficiency in water availability for<br />
specific agricultural needs, such as a deficiency in soil moisture, which is one <strong>of</strong> the most critical<br />
factors in defining crop production potential.<br />
Standardized Precipitation Index (SPI)<br />
<strong>Drought</strong> indices assimilate thousands <strong>of</strong> bits <strong>of</strong> data on rainfall, streamflow, and other water supply<br />
indicators into a comprehensible “big picture.” A drought index value is typically a single number,<br />
far more useful than raw data for decision making. Several indices measure how precipitation for a<br />
given period <strong>of</strong> time has deviated from historically established norms.<br />
The Standardized Precipitation Index (SPI) is an index based on the probability <strong>of</strong> precipitation for<br />
any time scale. It can be computed for different time scales to provide early warning <strong>of</strong> drought<br />
and help assess drought severity in any given locality. The SPI is designed to quantify the<br />
precipitation deficit for multiple time scales. These time scales reflect the impact <strong>of</strong> drought on the<br />
availability <strong>of</strong> the different water resources. Soil moisture conditions respond to precipitation<br />
anomalies on a relatively short scale. Groundwater, streamflow, and reservoir storage reflect the<br />
longer-term precipitation anomalies. McKee et al. (1993) originally calculated the SPI for 3-, 6-,<br />
12-, 24-, and 48-month time scales.<br />
The SPI calculation for the various agro-ecological zones in the GHA sub-region is based on the<br />
long-term precipitation record <strong>of</strong> more than thirty years. This long-term record is fitted to a<br />
probability distribution, which is then transformed into a normal distribution so that the mean SPI<br />
for the zone and desired period is zero (Edwards and McKee 1997). Positive SPI values indicate<br />
greater than median precipitation, and negative values indicate less than median precipitation.<br />
Because the SPI is normalized, wetter and drier climates can be represented in the same way, and<br />
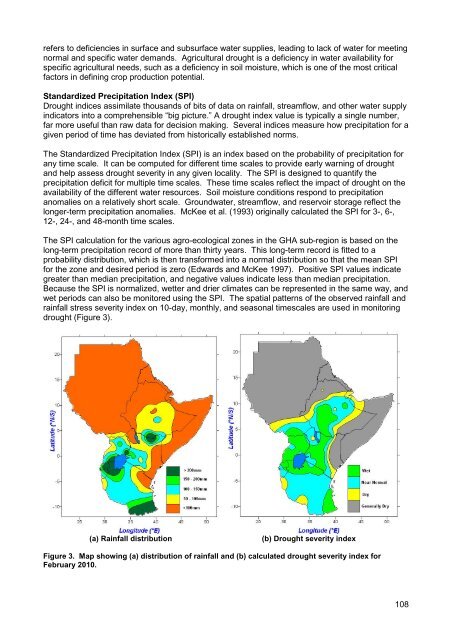
wet periods can also be monitored using the SPI. The spatial patterns <strong>of</strong> the observed rainfall and<br />
rainfall stress severity index on 10-day, monthly, and seasonal timescales are used in monitoring<br />
drought (Figure 3).<br />
(a) Rainfall distribution<br />
(b) <strong>Drought</strong> severity index<br />
Figure 3. Map showing (a) distribution <strong>of</strong> rainfall and (b) calculated drought severity index for<br />
February 2010.<br />
108


