

Agricultural Drought Indices - US Department of Agriculture
Agricultural Drought Indices - US Department of Agriculture
Agricultural Drought Indices - US Department of Agriculture

Create successful ePaper yourself
Turn your PDF publications into a flip-book with our unique Google optimized e-Paper software.
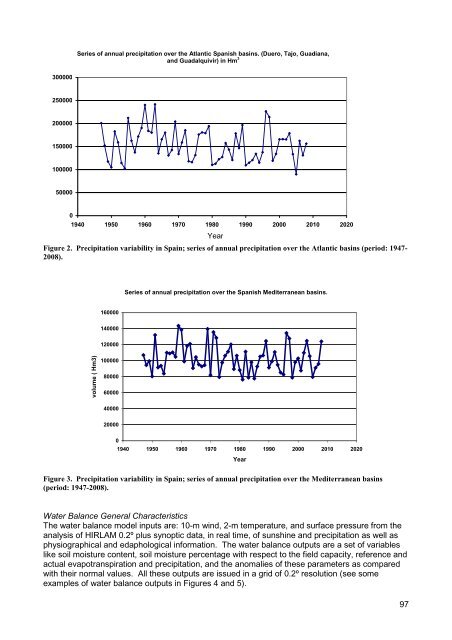
Series <strong>of</strong> annual precipitation over the Atlantic Spanish basins. (Duero, Tajo, Guadiana,<br />
and Guadalquivir) in Hm 3<br />
300000<br />
250000<br />
200000<br />
150000<br />
100000<br />
50000<br />
0<br />
1940 1950 1960 1970 1980 1990 2000 2010 2020<br />
Year<br />
Figure 2. Precipitation variability in Spain; series <strong>of</strong> annual precipitation over the Atlantic basins (period: 1947-<br />
2008).<br />
Series <strong>of</strong> annual precipitation over the Spanish Mediterranean basins.<br />
160000<br />
140000<br />
120000<br />
volume ( Hm3)<br />
100000<br />
80000<br />
60000<br />
40000<br />
20000<br />
0<br />
1940 1950 1960 1970 1980 1990 2000 2010 2020<br />
Year<br />
Figure 3. Precipitation variability in Spain; series <strong>of</strong> annual precipitation over the Mediterranean basins<br />
(period: 1947-2008).<br />
Water Balance General Characteristics<br />
The water balance model inputs are: 10-m wind, 2-m temperature, and surface pressure from the<br />
analysis <strong>of</strong> HIRLAM 0.2º plus synoptic data, in real time, <strong>of</strong> sunshine and precipitation as well as<br />
physiographical and edaphological information. The water balance outputs are a set <strong>of</strong> variables<br />
like soil moisture content, soil moisture percentage with respect to the field capacity, reference and<br />
actual evapotranspiration and precipitation, and the anomalies <strong>of</strong> these parameters as compared<br />
with their normal values. All these outputs are issued in a grid <strong>of</strong> 0.2º resolution (see some<br />
examples <strong>of</strong> water balance outputs in Figures 4 and 5).<br />
97


