

Agricultural Drought Indices - US Department of Agriculture
Agricultural Drought Indices - US Department of Agriculture
Agricultural Drought Indices - US Department of Agriculture

You also want an ePaper? Increase the reach of your titles
YUMPU automatically turns print PDFs into web optimized ePapers that Google loves.
supply and demand are fully taken into consideration. It is a key for more complex crop modelling,<br />
but it requires more data because <strong>of</strong> the increased number <strong>of</strong> parameters included. Data<br />
availability at the station level can be an issue, and different water balance models are usually<br />
location-specific and require local calibration, which makes intercomparison difficult.<br />
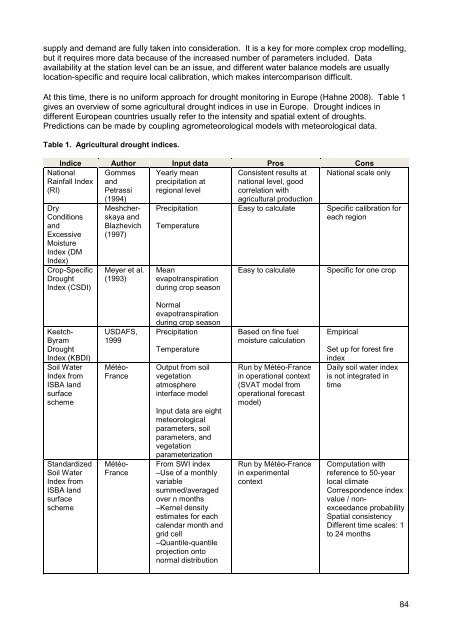
At this time, there is no uniform approach for drought monitoring in Europe (Hahne 2008). Table 1<br />
gives an overview <strong>of</strong> some agricultural drought indices in use in Europe. <strong>Drought</strong> indices in<br />
different European countries usually refer to the intensity and spatial extent <strong>of</strong> droughts.<br />
Predictions can be made by coupling agrometeorological models with meteorological data.<br />
Table 1. <strong>Agricultural</strong> drought indices.<br />
Indice Author Input data Pros Cons<br />
Gommes Yearly mean<br />
Consistent results at National scale only<br />
and<br />
precipitation at national level, good<br />
Petrassi regional level correlation with<br />
(1994)<br />
agricultural production<br />
National<br />
Rainfall Index<br />
(RI)<br />
Dry<br />
Conditions<br />
and<br />
Excessive<br />
Moisture<br />
Index (DM<br />
Index)<br />
Crop-Specific<br />
<strong>Drought</strong><br />
Index (CSDI)<br />
Meshcherskaya<br />
and<br />
Blazhevich<br />
(1997)<br />
Meyer et al.<br />
(1993)<br />
Precipitation<br />
Temperature<br />
Mean<br />
evapotranspiration<br />
during crop season<br />
Easy to calculate<br />
Easy to calculate<br />
Specific calibration for<br />
each region<br />
Specific for one crop<br />
Keetch-<br />
Byram<br />
<strong>Drought</strong><br />
Index (KBDI)<br />
Soil Water<br />
Index from<br />
ISBA land<br />
surface<br />
scheme<br />
Standardized<br />
Soil Water<br />
Index from<br />
ISBA land<br />
surface<br />
scheme<br />
<strong>US</strong>DAFS,<br />
1999<br />
Météo-<br />
France<br />
Météo-<br />
France<br />
Normal<br />
evapotranspiration<br />
during crop season<br />
Precipitation<br />
Temperature<br />
Output from soil<br />
vegetation<br />
atmosphere<br />
interface model<br />
Input data are eight<br />
meteorological<br />
parameters, soil<br />
parameters, and<br />
vegetation<br />
parameterization<br />
From SWI index<br />
–Use <strong>of</strong> a monthly<br />
variable<br />
summed/averaged<br />
over n months<br />
–Kernel density<br />
estimates for each<br />
calendar month and<br />
grid cell<br />
–Quantile-quantile<br />
projection onto<br />
normal distribution<br />
Based on fine fuel<br />
moisture calculation<br />
Run by Météo-France<br />
in operational context<br />
(SVAT model from<br />
operational forecast<br />
model)<br />
Run by Météo-France<br />
in experimental<br />
context<br />
Empirical<br />
Set up for forest fire<br />
index<br />
Daily soil water index<br />
is not integrated in<br />
time<br />
Computation with<br />
reference to 50-year<br />
local climate<br />
Correspondence index<br />
value / nonexceedance<br />
probability<br />
Spatial consistency<br />
Different time scales: 1<br />
to 24 months<br />
84


