Education Sector Development Program - VLIR-UOS
Education Sector Development Program - VLIR-UOS
Education Sector Development Program - VLIR-UOS

Create successful ePaper yourself
Turn your PDF publications into a flip-book with our unique Google optimized e-Paper software.
<strong>Education</strong> <strong>Sector</strong> <strong>Development</strong> <strong>Program</strong> IV<br />
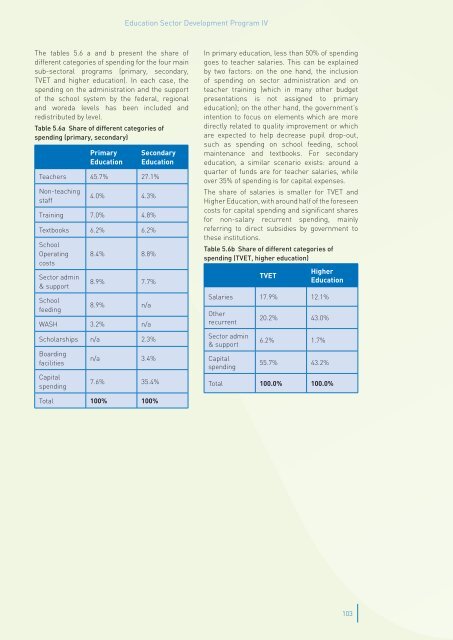
The tables 5.6 a and b present the share of<br />
different categories of spending for the four main<br />
sub-sectoral programs (primary, secondary,<br />
TVET and higher education). In each case, the<br />
spending on the administration and the support<br />
of the school system by the federal, regional<br />
and woreda levels has been included and<br />
redistributed by level.<br />
Table 5.6a Share of different categories of<br />
spending (primary, secondary)<br />
Primary<br />
<strong>Education</strong><br />
Secondary<br />
<strong>Education</strong><br />
Teachers 45.7% 27.1%<br />
Non-teaching<br />
staff<br />
4.0% 4.3%<br />
Training 7.0% 4.8%<br />
Textbooks 6.2% 6.2%<br />
School<br />
Operating<br />
costs<br />
<strong>Sector</strong> admin<br />
& support<br />
School<br />
feeding<br />
8.4% 8.8%<br />
8.9% 7.7%<br />
8.9% n/a<br />
WASH 3.2% n/a<br />
Scholarships n/a 2.3%<br />
Boarding<br />
facilities<br />
Capital<br />
spending<br />
n/a 3.4%<br />
7.6% 35.4%<br />
In primary education, less than 50% of spending<br />
goes to teacher salaries. This can be explained<br />
by two factors: on the one hand, the inclusion<br />
of spending on sector administration and on<br />
teacher training (which in many other budget<br />
presentations is not assigned to primary<br />
education); on the other hand, the government’s<br />
intention to focus on elements which are more<br />
directly related to quality improvement or which<br />
are expected to help decrease pupil drop-out,<br />
such as spending on school feeding, school<br />
maintenance and textbooks. For secondary<br />
education, a similar scenario exists: around a<br />
quarter of funds are for teacher salaries, while<br />
over 35% of spending is for capital expenses.<br />
The share of salaries is smaller for TVET and<br />
Higher <strong>Education</strong>, with around half of the foreseen<br />
costs for capital spending and significant shares<br />
for non-salary recurrent spending, mainly<br />
referring to direct subsidies by government to<br />
these institutions.<br />
Table 5.6b Share of different categories of<br />
spending (TVET, higher education)<br />
TVET<br />
Higher<br />
<strong>Education</strong><br />
Salaries 17.9% 12.1%<br />
Other<br />
recurrent<br />
<strong>Sector</strong> admin<br />
& support<br />
Capital<br />
spending<br />
20.2% 43.0%<br />
6.2% 1.7%<br />
55.7% 43.2%<br />
Total 100.0% 100.0%<br />
Total 100% 100%<br />
103