Sustainable Construction A Life Cycle Approach in Engineering
Sustainable Construction A Life Cycle Approach in Engineering
Sustainable Construction A Life Cycle Approach in Engineering

Create successful ePaper yourself
Turn your PDF publications into a flip-book with our unique Google optimized e-Paper software.
predicted, illustrated and listened to. Sound re<strong>in</strong>forcement is easily <strong>in</strong>tegrated <strong>in</strong> the acoustic<br />
predictions. Odeon uses image-source method comb<strong>in</strong>ed with ray trac<strong>in</strong>g.” (Odeon Room<br />
Acoustics Software)<br />
Acoustic Simulation of Cases<br />
There are three sources and m<strong>in</strong>imum 11 receiver po<strong>in</strong>ts <strong>in</strong> each room. The selected parameters<br />
to evaluate the acoustics of the cases are reverberation time (T30), early decay time (EDT),<br />
dist<strong>in</strong>ctness (D50), sound pressure level (SPL) and speech transmission <strong>in</strong>dex (STI).<br />
4. EVALUATION OF ROOMS<br />
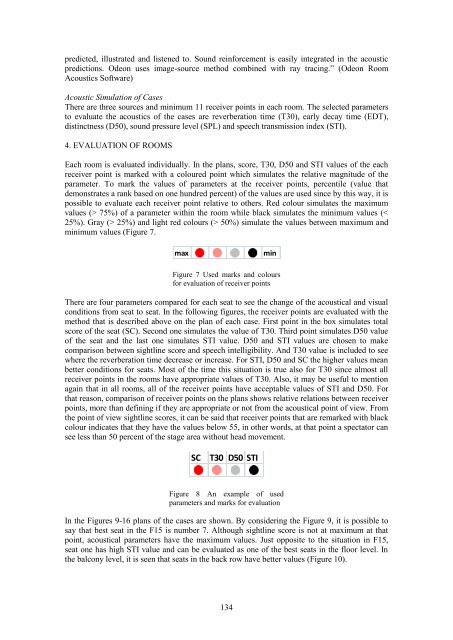
Each room is evaluated <strong>in</strong>dividually. In the plans, score, T30, D50 and STI values of the each<br />
receiver po<strong>in</strong>t is marked with a coloured po<strong>in</strong>t which simulates the relative magnitude of the<br />
parameter. To mark the values of parameters at the receiver po<strong>in</strong>ts, percentile (value that<br />
demonstrates a rank based on one hundred percent) of the values are used s<strong>in</strong>ce by this way, it is<br />
possible to evaluate each receiver po<strong>in</strong>t relative to others. Red colour simulates the maximum<br />
values (> 75%) of a parameter with<strong>in</strong> the room while black simulates the m<strong>in</strong>imum values (<<br />
25%). Gray (> 25%) and light red colours (> 50%) simulate the values between maximum and<br />
m<strong>in</strong>imum values (Figure 7.<br />
max<br />
m<strong>in</strong><br />
Figure 7 Used marks and colours<br />
for evaluation of receiver po<strong>in</strong>ts<br />
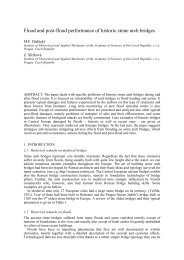
There are four parameters compared for each seat to see the change of the acoustical and visual<br />
conditions from seat to seat. In the follow<strong>in</strong>g figures, the receiver po<strong>in</strong>ts are evaluated with the<br />
method that is described above on the plan of each case. First po<strong>in</strong>t <strong>in</strong> the box simulates total<br />
score of the seat (SC). Second one simulates the value of T30. Third po<strong>in</strong>t simulates D50 value<br />
of the seat and the last one simulates STI value. D50 and STI values are chosen to make<br />
comparison between sightl<strong>in</strong>e score and speech <strong>in</strong>telligibility. And T30 value is <strong>in</strong>cluded to see<br />
where the reverberation time decrease or <strong>in</strong>crease. For STI, D50 and SC the higher values mean<br />
better conditions for seats. Most of the time this situation is true also for T30 s<strong>in</strong>ce almost all<br />
receiver po<strong>in</strong>ts <strong>in</strong> the rooms have appropriate values of T30. Also, it may be useful to mention<br />
aga<strong>in</strong> that <strong>in</strong> all rooms, all of the receiver po<strong>in</strong>ts have acceptable values of STI and D50. For<br />
that reason, comparison of receiver po<strong>in</strong>ts on the plans shows relative relations between receiver<br />
po<strong>in</strong>ts, more than def<strong>in</strong><strong>in</strong>g if they are appropriate or not from the acoustical po<strong>in</strong>t of view. From<br />
the po<strong>in</strong>t of view sightl<strong>in</strong>e scores, it can be said that receiver po<strong>in</strong>ts that are remarked with black<br />
colour <strong>in</strong>dicates that they have the values below 55, <strong>in</strong> other words, at that po<strong>in</strong>t a spectator can<br />
see less than 50 percent of the stage area without head movement.<br />
SC<br />
T30 D50 STI<br />
Figure 8 An example of used<br />
parameters and marks for evaluation<br />
In the Figures 9-16 plans of the cases are shown. By consider<strong>in</strong>g the Figure 9, it is possible to<br />
say that best seat <strong>in</strong> the F15 is number 7. Although sightl<strong>in</strong>e score is not at maximum at that<br />
po<strong>in</strong>t, acoustical parameters have the maximum values. Just opposite to the situation <strong>in</strong> F15,<br />
seat one has high STI value and can be evaluated as one of the best seats <strong>in</strong> the floor level. In<br />
the balcony level, it is seen that seats <strong>in</strong> the back row have better values (Figure 10).<br />
134
![Weibull [Compatibility Mode]](https://img.yumpu.com/48296360/1/190x134/weibull-compatibility-mode.jpg?quality=85)