Sustainable Construction A Life Cycle Approach in Engineering
Sustainable Construction A Life Cycle Approach in Engineering
Sustainable Construction A Life Cycle Approach in Engineering

Create successful ePaper yourself
Turn your PDF publications into a flip-book with our unique Google optimized e-Paper software.
IFCC-2.0<br />
IFCC-1.0<br />
IFCC-1.5<br />
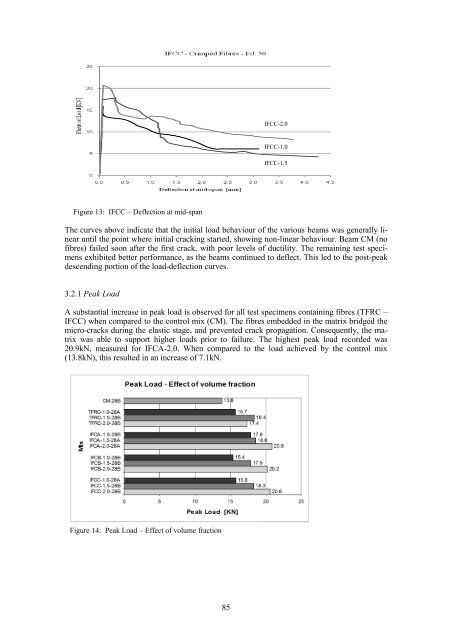
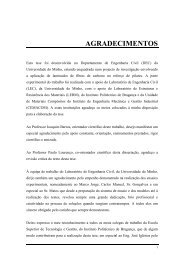
Figure 13: IFCC – Deflection at mid-span<br />
The curves above <strong>in</strong>dicate that the <strong>in</strong>itial load behaviour of the various beams was generally l<strong>in</strong>ear<br />
until the po<strong>in</strong>t where <strong>in</strong>itial crack<strong>in</strong>g started, show<strong>in</strong>g non-l<strong>in</strong>ear behaviour. Beam CM (no<br />
fibres) failed soon after the first crack, with poor levels of ductility. The rema<strong>in</strong><strong>in</strong>g test specimens<br />
exhibited better performance, as the beams cont<strong>in</strong>ued to deflect. This led to the post-peak<br />
descend<strong>in</strong>g portion of the load-deflection curves.<br />
3.2.1 Peak Load<br />
A substantial <strong>in</strong>crease <strong>in</strong> peak load is observed for all test specimens conta<strong>in</strong><strong>in</strong>g fibres (TFRC –<br />
IFCC) when compared to the control mix (CM). The fibres embedded <strong>in</strong> the matrix bridged the<br />
micro-cracks dur<strong>in</strong>g the elastic stage, and prevented crack propagation. Consequently, the matrix<br />
was able to support higher loads prior to failure. The highest peak load recorded was<br />
20.9kN, measured for IFCA-2.0. When compared to the load achieved by the control mix<br />
(13.8kN), this resulted <strong>in</strong> an <strong>in</strong>crease of 7.1kN.<br />
Figure 14: Peak Load – Effect of volume fraction<br />
85
![Weibull [Compatibility Mode]](https://img.yumpu.com/48296360/1/190x134/weibull-compatibility-mode.jpg?quality=85)