Sustainable Construction A Life Cycle Approach in Engineering
Sustainable Construction A Life Cycle Approach in Engineering
Sustainable Construction A Life Cycle Approach in Engineering

Create successful ePaper yourself
Turn your PDF publications into a flip-book with our unique Google optimized e-Paper software.
<strong>in</strong>fluence, will be considered more <strong>in</strong> detail <strong>in</strong> further <strong>in</strong>vestigations for the sake of completeness.<br />
The life time is yet unknown, but it is expected to be at least 25 years.<br />
The end-of-life scenario is modelled consider<strong>in</strong>g two alternatives. The eco<strong>in</strong>vent database<br />
provides sophisticated data that can be used for the first case: <strong>in</strong>c<strong>in</strong>eration of the whole profile<br />
<strong>in</strong> a municipal waste <strong>in</strong>c<strong>in</strong>erator. All emissions as well as the f<strong>in</strong>al disposal of slag are considered<br />
here. For the second end-of-life scenario the recovery of the wood-embodied energy is <strong>in</strong>vestigated:<br />
the share of wood is assumed to be <strong>in</strong>c<strong>in</strong>erated <strong>in</strong> a comb<strong>in</strong>ed heat and power plant,<br />
consider<strong>in</strong>g emissions, slag and benefits of the energy recovery. This is what is often referred to<br />
as the system boundary expansion. Negative <strong>in</strong>puts can not easily be modelled <strong>in</strong> an adequate<br />
manner, positive impacts are accounted for by modell<strong>in</strong>g "avoided products" as <strong>in</strong>puts (Goedkoop<br />
et al. 2007). In this case, avoided products are electricity and gas that would be needed to<br />
produce the amount of energy that is recovered <strong>in</strong> the comb<strong>in</strong>ed heat and power plant.<br />
For the production phase, transports are <strong>in</strong>cluded <strong>in</strong> the eco<strong>in</strong>vent database as cradle-to-gate,<br />
while the end-of life scenarios are modelled as gate-to grave. Consequently further transports<br />
have to be considered additionally: a) from the production plants of the material <strong>in</strong>puts to production<br />
plant of the f<strong>in</strong>al product; b) between different production plants <strong>in</strong> the value-addedcha<strong>in</strong>;<br />
c) from the last production plant to the site and d) from the site to the end-of-life scenario.<br />
To simplify these complex but as well uncerta<strong>in</strong> processes we assume each transport way to<br />
be 120 km and multiply this by the total weight of the f<strong>in</strong>al product. This leads to an additional<br />
transport effort of 120km * 28 kg = 14 tkm.<br />
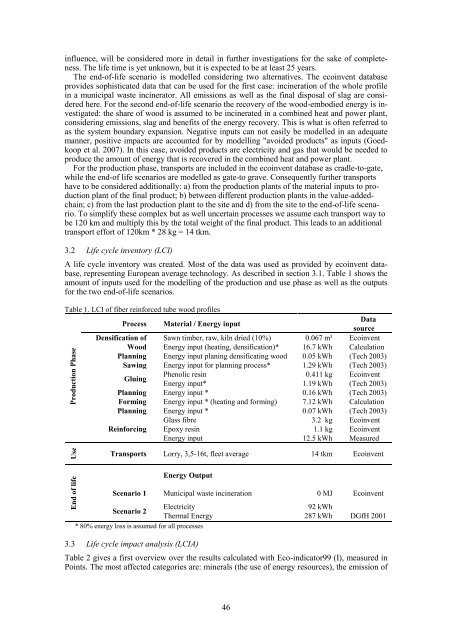
3.2 <strong>Life</strong> cycle <strong>in</strong>ventory (LCI)<br />
A life cycle <strong>in</strong>ventory was created. Most of the data was used as provided by eco<strong>in</strong>vent database,<br />
represent<strong>in</strong>g European average technology. As described <strong>in</strong> section 3.1. Table 1 shows the<br />
amount of <strong>in</strong>puts used for the modell<strong>in</strong>g of the production and use phase as well as the outputs<br />
for the two end-of-life scenarios.<br />
Table 1. LCI of fiber re<strong>in</strong>forced tube wood profiles<br />
Process Material / Energy <strong>in</strong>put<br />
Data<br />
source<br />
Densification of Sawn timber, raw, kiln dried (10%) 0.067 m³ Eco<strong>in</strong>vent<br />
Wood Energy <strong>in</strong>put (heat<strong>in</strong>g, densification)* 16.7 kWh Calculation<br />
Plann<strong>in</strong>g Energy <strong>in</strong>put plan<strong>in</strong>g densificat<strong>in</strong>g wood 0.05 kWh (Tech 2003)<br />
Saw<strong>in</strong>g Energy <strong>in</strong>put for plann<strong>in</strong>g process* 1.29 kWh (Tech 2003)<br />
Glu<strong>in</strong>g<br />
Phenolic res<strong>in</strong><br />
0.411 kg Eco<strong>in</strong>vent<br />
Energy <strong>in</strong>put*<br />
1.19 kWh (Tech 2003)<br />
Plann<strong>in</strong>g Energy <strong>in</strong>put * 0.16 kWh (Tech 2003)<br />
Form<strong>in</strong>g Energy <strong>in</strong>put * (heat<strong>in</strong>g and form<strong>in</strong>g) 7.12 kWh Calculation<br />
Plann<strong>in</strong>g Energy <strong>in</strong>put * 0.07 kWh (Tech 2003)<br />
Glass fibre<br />
3.2 kg Eco<strong>in</strong>vent<br />
Re<strong>in</strong>forc<strong>in</strong>g Epoxy res<strong>in</strong><br />
1.1 kg Eco<strong>in</strong>vent<br />
Energy <strong>in</strong>put<br />
12.5 kWh Measured<br />
Production Phase<br />
Use<br />
Transports Lorry, 3,5-16t, fleet average 14 tkm Eco<strong>in</strong>vent<br />
End of life<br />
Energy Output<br />
Scenario 1 Municipal waste <strong>in</strong>c<strong>in</strong>eration 0 MJ Eco<strong>in</strong>vent<br />
Electricity<br />
Scenario 2<br />
Thermal Energy<br />
* 80% energy loss is assumed for all processes<br />
92 kWh<br />
287 kWh DGfH 2001<br />
3.3 <strong>Life</strong> cycle impact analysis (LCIA)<br />
Table 2 gives a first overview over the results calculated with Eco-<strong>in</strong>dicator99 (I), measured <strong>in</strong><br />
Po<strong>in</strong>ts. The most affected categories are: m<strong>in</strong>erals (the use of energy resources), the emission of<br />
46
![Weibull [Compatibility Mode]](https://img.yumpu.com/48296360/1/190x134/weibull-compatibility-mode.jpg?quality=85)