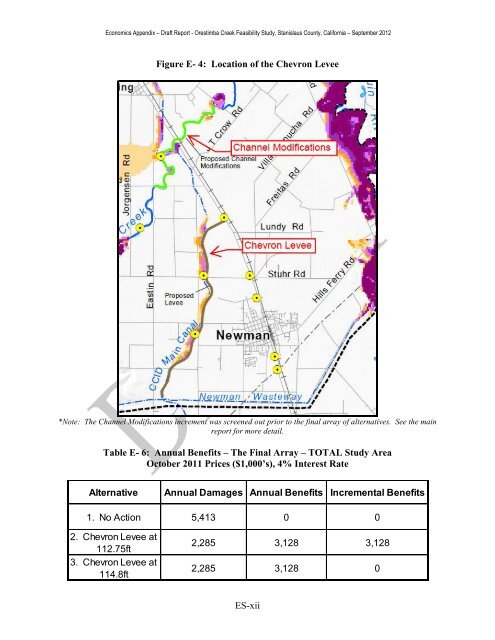
Economics Appendix – Draft Report - <strong>Orestimba</strong> <strong>Creek</strong> <strong>Feasibility</strong> <strong>Study</strong>, <strong>Stanislaus</strong> <strong>County</strong>, California – September 2012 Figure E- 4: Location of the Chevron Levee *Note: The Channel Modifications increment was screened out prior to the final array of alternatives. See the main report for more detail. Table E- 6: Annual Benefits – The Final Array – TOTAL <strong>Study</strong> Area October 2011 Prices ($1,000’s), 4% Interest Rate Alternative Annual Damages Annual Benefits Incremental Benefits 1. No Action 5,413 0 0 2. Chevron Levee at 112.75ft 3. Chevron Levee at 114.8ft 2,285 3,128 3,128 2,285 3,128 0 ES-xii
Economics Appendix – Draft Report - <strong>Orestimba</strong> <strong>Creek</strong> <strong>Feasibility</strong> <strong>Study</strong>, <strong>Stanislaus</strong> <strong>County</strong>, California – September 2012 Probability Distribution of Damages Reduced In accordance with ER 1105-2-101, flood damages reduced were determined as mean values and by probability exceeded. The tables below show the benefits for each alternative for the 75%, 50% and 25% probability that benefit exceeds indicated value. The damage reduced column represents the mean benefits for each increment and the 75%, 50% and 25% represent the probability that the flood damage reduction benefits exceed the number in that column for that increment. For example, Alternative 2, the Chevron Levee, has an average (mean) benefit of $3.1 million, but a 50% chance that benefits will be greater than $$2.7 million, 75% confidence that benefits will be equal or greater than $1.3 million and 25% confidence that benefits will exceed $4.4 million. This range is the probability distribution of damages reduced and represents the uncertainty in the benefit estimates and incorporates all the uncertainties in hydrology, hydraulics, and economics in the HEC-FDA model. The uncertainty in damages reduced should be considered when selecting an optimal plan during the plan formulation process. Judgment should be used to determine if an alternative meets a reasonable level of confidence regarding positive net benefits and identifying if changes in net benefits from alternative to alternative are significant. Table E- 7: Probability Distribution of Damages Reduced – TOTAL <strong>Study</strong> Area October 2011 Prices ($1,000’s), 4% Interest Rate Alternative Without Project Annual Damage With Project Damage Reduced Probability Damage Reduced Exceeds Indicated Values 75% 50% 25% 1. No Action 5,413 5,413 0 0 0 0 2. Chevron Levee at 112.75ft 3. Chevron Levee at 114.8ft 5,413 2,285 3,128 1,282 2,679 4,363 5,413 2,285 3,128 1,282 2,679 4,363 ES.6 Project Performance In addition to damages estimates, HEC-FDA reports flood risk in terms of project performance. Three statistical measures are provided, in accordance with ER 1105-2-101, to describe performance risk in probabilistic terms. These include annual exceedance probability, long-term risk, and assurance by event. Annual exceedance probability measures the chance of having a damaging flood in any given year. ES-xiii