Orestimba Creek Feasibility Study - Stanislaus County
Orestimba Creek Feasibility Study - Stanislaus County
Orestimba Creek Feasibility Study - Stanislaus County

Create successful ePaper yourself
Turn your PDF publications into a flip-book with our unique Google optimized e-Paper software.
Economics Appendix – Draft Report - <strong>Orestimba</strong> <strong>Creek</strong> <strong>Feasibility</strong> <strong>Study</strong>, <strong>Stanislaus</strong> <strong>County</strong>, California – September 2012<br />
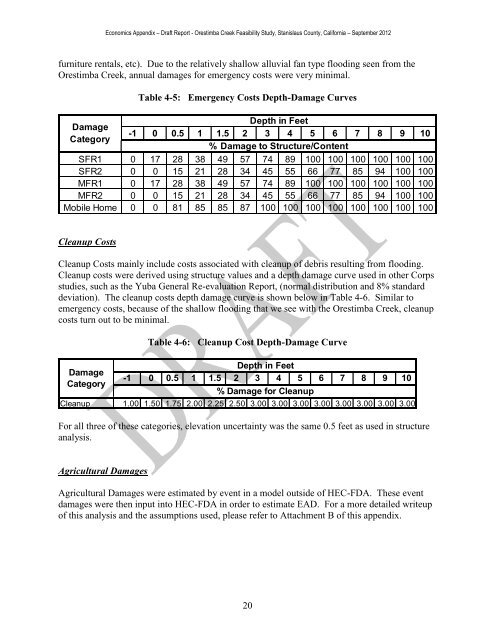
furniture rentals, etc). Due to the relatively shallow alluvial fan type flooding seen from the<br />
<strong>Orestimba</strong> <strong>Creek</strong>, annual damages for emergency costs were very minimal.<br />
Damage<br />
Category<br />
Table 4-5: Emergency Costs Depth-Damage Curves<br />
Depth in Feet<br />
-1 0 0.5 1 1.5 2 3 4 5 6 7 8 9 10<br />
% Damage to Structure/Content<br />
SFR1 0 17 28 38 49 57 74 89 100 100 100 100 100 100<br />
SFR2 0 0 15 21 28 34 45 55 66 77 85 94 100 100<br />
MFR1 0 17 28 38 49 57 74 89 100 100 100 100 100 100<br />
MFR2 0 0 15 21 28 34 45 55 66 77 85 94 100 100<br />
Mobile Home 0 0 81 85 85 87 100 100 100 100 100 100 100 100<br />
Cleanup Costs<br />
Cleanup Costs mainly include costs associated with cleanup of debris resulting from flooding.<br />
Cleanup costs were derived using structure values and a depth damage curve used in other Corps<br />
studies, such as the Yuba General Re-evaluation Report, (normal distribution and 8% standard<br />
deviation). The cleanup costs depth damage curve is shown below in Table 4-6. Similar to<br />
emergency costs, because of the shallow flooding that we see with the <strong>Orestimba</strong> <strong>Creek</strong>, cleanup<br />
costs turn out to be minimal.<br />
Damage<br />
Category<br />
Table 4-6: Cleanup Cost Depth-Damage Curve<br />
Depth in Feet<br />
-1 0 0.5 1 1.5 2 3 4 5 6 7 8 9 10<br />
% Damage for Cleanup<br />
Cleanup 1.00 1.50 1.75 2.00 2.25 2.50 3.00 3.00 3.00 3.00 3.00 3.00 3.00 3.00<br />
For all three of these categories, elevation uncertainty was the same 0.5 feet as used in structure<br />
analysis.<br />
Agricultural Damages<br />
Agricultural Damages were estimated by event in a model outside of HEC-FDA. These event<br />
damages were then input into HEC-FDA in order to estimate EAD. For a more detailed writeup<br />
of this analysis and the assumptions used, please refer to Attachment B of this appendix.<br />
20