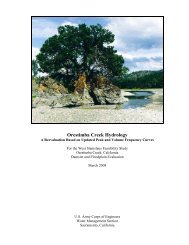
Orestimba Creek Feasibility Study - Stanislaus County
Orestimba Creek Feasibility Study - Stanislaus County
Orestimba Creek Feasibility Study - Stanislaus County

You also want an ePaper? Increase the reach of your titles
YUMPU automatically turns print PDFs into web optimized ePapers that Google loves.
Economics Appendix – Draft Report - <strong>Orestimba</strong> <strong>Creek</strong> <strong>Feasibility</strong> <strong>Study</strong>, <strong>Stanislaus</strong> <strong>County</strong>, California – September 2012<br />
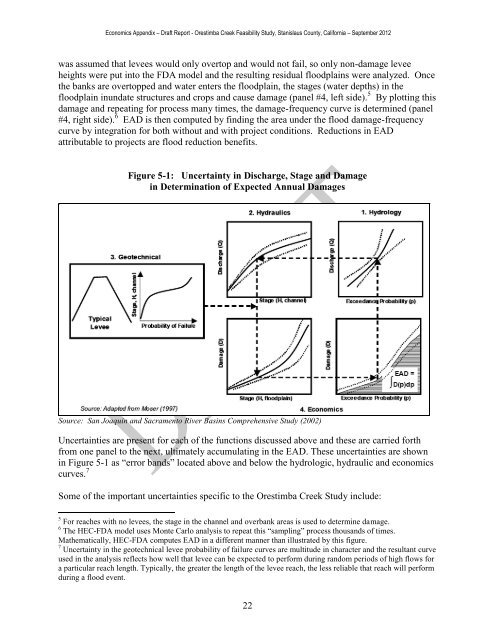
was assumed that levees would only overtop and would not fail, so only non-damage levee<br />
heights were put into the FDA model and the resulting residual floodplains were analyzed. Once<br />
the banks are overtopped and water enters the floodplain, the stages (water depths) in the<br />
floodplain inundate structures and crops and cause damage (panel #4, left side). 5 By plotting this<br />
damage and repeating for process many times, the damage-frequency curve is determined (panel<br />
#4, right side). 6 EAD is then computed by finding the area under the flood damage-frequency<br />
curve by integration for both without and with project conditions. Reductions in EAD<br />
attributable to projects are flood reduction benefits.<br />
Figure 5-1: Uncertainty in Discharge, Stage and Damage<br />
in Determination of Expected Annual Damages<br />
Source: San Joaquin and Sacramento River Basins Comprehensive <strong>Study</strong> (2002)<br />
Uncertainties are present for each of the functions discussed above and these are carried forth<br />
from one panel to the next, ultimately accumulating in the EAD. These uncertainties are shown<br />
in Figure 5-1 as “error bands” located above and below the hydrologic, hydraulic and economics<br />
curves. 7<br />
Some of the important uncertainties specific to the <strong>Orestimba</strong> <strong>Creek</strong> <strong>Study</strong> include:<br />
5 For reaches with no levees, the stage in the channel and overbank areas is used to determine damage.<br />
6 The HEC-FDA model uses Monte Carlo analysis to repeat this “sampling” process thousands of times.<br />
Mathematically, HEC-FDA computes EAD in a different manner than illustrated by this figure.<br />
7 Uncertainty in the geotechnical levee probability of failure curves are multitude in character and the resultant curve<br />
used in the analysis reflects how well that levee can be expected to perform during random periods of high flows for<br />
a particular reach length. Typically, the greater the length of the levee reach, the less reliable that reach will perform<br />
during a flood event.<br />
22