Orestimba Creek Feasibility Study - Stanislaus County
Orestimba Creek Feasibility Study - Stanislaus County
Orestimba Creek Feasibility Study - Stanislaus County

Create successful ePaper yourself
Turn your PDF publications into a flip-book with our unique Google optimized e-Paper software.
Economics Appendix – Draft Report - <strong>Orestimba</strong> <strong>Creek</strong> <strong>Feasibility</strong> <strong>Study</strong>, <strong>Stanislaus</strong> <strong>County</strong>, California – September 2012<br />
million, a large proportion of estimates are off by at least a factor of two and sometimes much<br />
more.”<br />
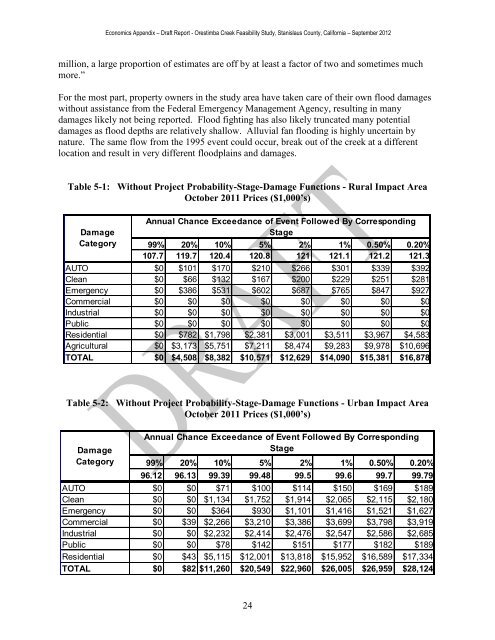
For the most part, property owners in the study area have taken care of their own flood damages<br />
without assistance from the Federal Emergency Management Agency, resulting in many<br />
damages likely not being reported. Flood fighting has also likely truncated many potential<br />
damages as flood depths are relatively shallow. Alluvial fan flooding is highly uncertain by<br />
nature. The same flow from the 1995 event could occur, break out of the creek at a different<br />
location and result in very different floodplains and damages.<br />
Table 5-1: Without Project Probability-Stage-Damage Functions - Rural Impact Area<br />
October 2011 Prices ($1,000’s)<br />
Damage<br />
Category<br />
Annual Chance Exceedance of Event Followed By Corresponding<br />
Stage<br />
99% 20% 10% 5% 2% 1% 0.50% 0.20%<br />
107.7 119.7 120.4 120.8 121 121.1 121.2 121.3<br />
AUTO $0 $101 $170 $210 $266 $301 $339 $392<br />
Clean $0 $66 $132 $167 $200 $229 $251 $281<br />
Emergency $0 $386 $531 $602 $687 $765 $847 $927<br />
Commercial $0 $0 $0 $0 $0 $0 $0 $0<br />
Industrial $0 $0 $0 $0 $0 $0 $0 $0<br />
Public $0 $0 $0 $0 $0 $0 $0 $0<br />
Residential $0 $782 $1,798 $2,381 $3,001 $3,511 $3,967 $4,583<br />
Agricultural $0 $3,173 $5,751 $7,211 $8,474 $9,283 $9,978 $10,696<br />
TOTAL $0 $4,508 $8,382 $10,571 $12,629 $14,090 $15,381 $16,878<br />
Table 5-2: Without Project Probability-Stage-Damage Functions - Urban Impact Area<br />
October 2011 Prices ($1,000’s)<br />
Damage<br />
Category<br />
Annual Chance Exceedance of Event Followed By Corresponding<br />
Stage<br />
99% 20% 10% 5% 2% 1% 0.50% 0.20%<br />
96.12 96.13 99.39 99.48 99.5 99.6 99.7 99.79<br />
AUTO $0 $0 $71 $100 $114 $150 $169 $189<br />
Clean $0 $0 $1,134 $1,752 $1,914 $2,065 $2,115 $2,180<br />
Emergency $0 $0 $364 $930 $1,101 $1,416 $1,521 $1,627<br />
Commercial $0 $39 $2,266 $3,210 $3,386 $3,699 $3,798 $3,919<br />
Industrial $0 $0 $2,232 $2,414 $2,476 $2,547 $2,586 $2,685<br />
Public $0 $0 $78 $142 $151 $177 $182 $189<br />
Residential $0 $43 $5,115 $12,001 $13,818 $15,952 $16,589 $17,334<br />
TOTAL $0 $82 $11,260 $20,549 $22,960 $26,005 $26,959 $28,124<br />
24