Impact Assessment of the District Poverty Initiative Project Rajasthan
Impact Assessment of the District Poverty Initiative Project Rajasthan
Impact Assessment of the District Poverty Initiative Project Rajasthan

You also want an ePaper? Increase the reach of your titles
YUMPU automatically turns print PDFs into web optimized ePapers that Google loves.
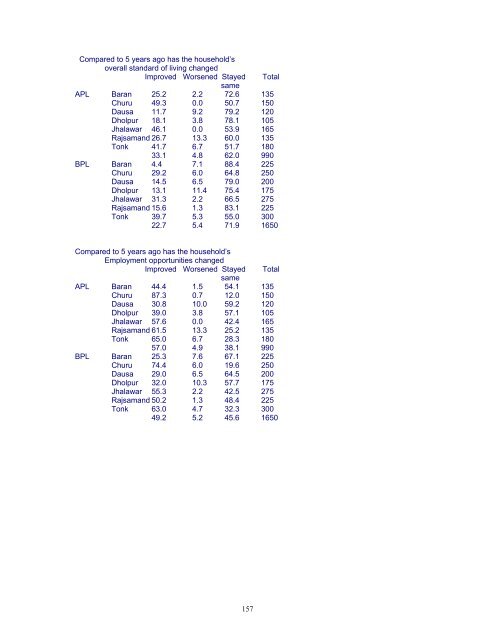
Compared to 5 years ago has <strong>the</strong> household’s<br />
overall standard <strong>of</strong> living changed<br />
Improved Worsened Stayed Total<br />
same<br />
APL Baran 25.2 2.2 72.6 135<br />
Churu 49.3 0.0 50.7 150<br />
Dausa 11.7 9.2 79.2 120<br />
Dholpur 18.1 3.8 78.1 105<br />
Jhalawar 46.1 0.0 53.9 165<br />
Rajsamand 26.7 13.3 60.0 135<br />
Tonk 41.7 6.7 51.7 180<br />
33.1 4.8 62.0 990<br />
BPL Baran 4.4 7.1 88.4 225<br />
Churu 29.2 6.0 64.8 250<br />
Dausa 14.5 6.5 79.0 200<br />
Dholpur 13.1 11.4 75.4 175<br />
Jhalawar 31.3 2.2 66.5 275<br />
Rajsamand 15.6 1.3 83.1 225<br />
Tonk 39.7 5.3 55.0 300<br />
22.7 5.4 71.9 1650<br />
Compared to 5 years ago has <strong>the</strong> household’s<br />
Employment opportunities changed<br />
Improved Worsened Stayed Total<br />
same<br />
APL Baran 44.4 1.5 54.1 135<br />
Churu 87.3 0.7 12.0 150<br />
Dausa 30.8 10.0 59.2 120<br />
Dholpur 39.0 3.8 57.1 105<br />
Jhalawar 57.6 0.0 42.4 165<br />
Rajsamand 61.5 13.3 25.2 135<br />
Tonk 65.0 6.7 28.3 180<br />
57.0 4.9 38.1 990<br />
BPL Baran 25.3 7.6 67.1 225<br />
Churu 74.4 6.0 19.6 250<br />
Dausa 29.0 6.5 64.5 200<br />
Dholpur 32.0 10.3 57.7 175<br />
Jhalawar 55.3 2.2 42.5 275<br />
Rajsamand 50.2 1.3 48.4 225<br />
Tonk 63.0 4.7 32.3 300<br />
49.2 5.2 45.6 1650<br />
157