Impact Assessment of the District Poverty Initiative Project Rajasthan
Impact Assessment of the District Poverty Initiative Project Rajasthan
Impact Assessment of the District Poverty Initiative Project Rajasthan

Create successful ePaper yourself
Turn your PDF publications into a flip-book with our unique Google optimized e-Paper software.
N 3 5 1 2<br />
Churu Mean 3045 20501 7419 22752 144 11<br />
N 1 5 1 3<br />
Dausa Mean 8844 10426 7419 -100 -29<br />
N 7 11 2<br />
Dholpur Mean 10656 5074 -100 -100<br />
N 2 1<br />
Jhalawar Mean 2436 -100<br />
N 1<br />
Rajsamand Mean 6089 29192 9645 -100 -67<br />
N 1 11 2<br />
Tonk Mean 12788 6191 5045 4451 -61 -28<br />
N 5 5 5 1<br />
Total Mean 10897 16132 6571 13948 -40 -14<br />
N 19 39 7 10<br />
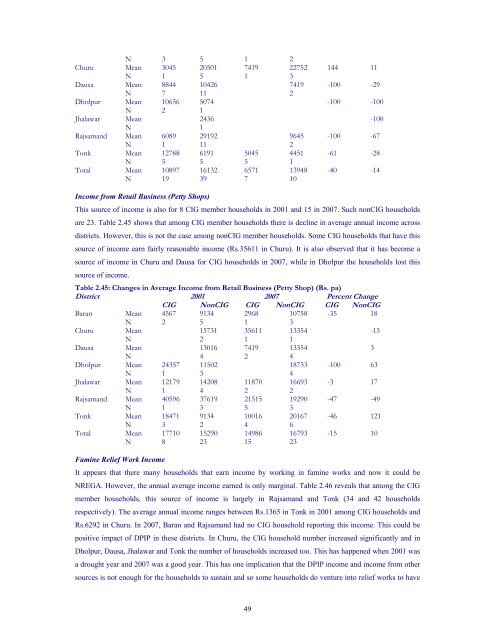
Income from Retail Business (Petty Shops)<br />
This source <strong>of</strong> income is also for 8 CIG member households in 2001 and 15 in 2007. Such nonCIG households<br />
are 23. Table 2.45 shows that among CIG member households <strong>the</strong>re is decline in average annual income across<br />
districts. However, this is not <strong>the</strong> case among nonCIG member households. Some CIG households that have this<br />
source <strong>of</strong> income earn fairly reasonable income (Rs.35611 in Churu). It is also observed that it has become a<br />
source <strong>of</strong> income in Churu and Dausa for CIG households in 2007, while in Dholpur <strong>the</strong> households lost this<br />
source <strong>of</strong> income.<br />
Table 2.45: Changes in Average Income from Retail Business (Petty Shop) (Rs. pa)<br />
<strong>District</strong> 2001 2007 Percent Change<br />
CIG NonCIG CIG NonCIG CIG NonCIG<br />
Baran Mean 4567 9134 2968 10758 -35 18<br />
N 2 5 1 3<br />
Churu Mean 15731 35611 13354 -15<br />
N 2 1 1<br />
Dausa Mean 13016 7419 13354 3<br />
N 4 2 4<br />
Dholpur Mean 24357 11502 18733 -100 63<br />
N 1 3 4<br />
Jhalawar Mean 12179 14208 11870 16693 -3 17<br />
N 1 4 2 2<br />
Rajsamand Mean 40596 37619 21515 19290 -47 -49<br />
N 1 3 5 3<br />
Tonk Mean 18471 9134 10016 20167 -46 121<br />
N 3 2 4 6<br />
Total Mean 17710 15290 14986 16793 -15 10<br />
N 8 23 15 23<br />
Famine Relief Work Income<br />
It appears that <strong>the</strong>re many households that earn income by working in famine works and now it could be<br />
NREGA. However, <strong>the</strong> annual average income earned is only marginal. Table 2.46 reveals that among <strong>the</strong> CIG<br />
member households, this source <strong>of</strong> income is largely in Rajsamand and Tonk (34 and 42 households<br />
respectively). The average annual income ranges between Rs.1365 in Tonk in 2001 among CIG households and<br />
Rs.6292 in Churu. In 2007, Baran and Rajsamand had no CIG household reporting this income. This could be<br />
positive impact <strong>of</strong> DPIP in <strong>the</strong>se districts. In Churu, <strong>the</strong> CIG household number increased significantly and in<br />
Dholpur, Dausa, Jhalawar and Tonk <strong>the</strong> number <strong>of</strong> households increased too. This has happened when 2001 was<br />
a drought year and 2007 was a good year. This has one implication that <strong>the</strong> DPIP income and income from o<strong>the</strong>r<br />
sources is not enough for <strong>the</strong> households to sustain and so some households do venture into relief works to have<br />
49