Impact Assessment of the District Poverty Initiative Project Rajasthan
Impact Assessment of the District Poverty Initiative Project Rajasthan
Impact Assessment of the District Poverty Initiative Project Rajasthan

You also want an ePaper? Increase the reach of your titles
YUMPU automatically turns print PDFs into web optimized ePapers that Google loves.
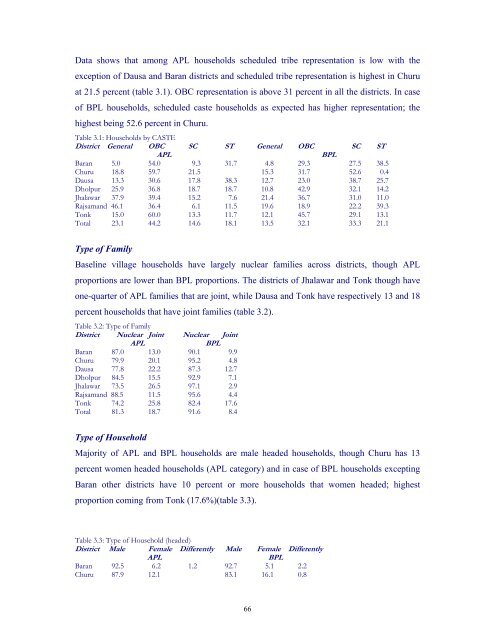
Data shows that among APL households scheduled tribe representation is low with <strong>the</strong><br />
exception <strong>of</strong> Dausa and Baran districts and scheduled tribe representation is highest in Churu<br />
at 21.5 percent (table 3.1). OBC representation is above 31 percent in all <strong>the</strong> districts. In case<br />
<strong>of</strong> BPL households, scheduled caste households as expected has higher representation; <strong>the</strong><br />
highest being 52.6 percent in Churu.<br />
Table 3.1: Households by CASTE<br />
<strong>District</strong> General OBC SC ST General OBC SC ST<br />
APL<br />
BPL<br />
Baran 5.0 54.0 9.3 31.7 4.8 29.3 27.5 38.5<br />
Churu 18.8 59.7 21.5 15.3 31.7 52.6 0.4<br />
Dausa 13.3 30.6 17.8 38.3 12.7 23.0 38.7 25.7<br />
Dholpur 25.9 36.8 18.7 18.7 10.8 42.9 32.1 14.2<br />
Jhalawar 37.9 39.4 15.2 7.6 21.4 36.7 31.0 11.0<br />
Rajsamand 46.1 36.4 6.1 11.5 19.6 18.9 22.2 39.3<br />
Tonk 15.0 60.0 13.3 11.7 12.1 45.7 29.1 13.1<br />
Total 23.1 44.2 14.6 18.1 13.5 32.1 33.3 21.1<br />
Type <strong>of</strong> Family<br />
Baseline village households have largely nuclear families across districts, though APL<br />
proportions are lower than BPL proportions. The districts <strong>of</strong> Jhalawar and Tonk though have<br />
one-quarter <strong>of</strong> APL families that are joint, while Dausa and Tonk have respectively 13 and 18<br />
percent households that have joint families (table 3.2).<br />
Table 3.2: Type <strong>of</strong> Family<br />
<strong>District</strong> Nuclear Joint Nuclear Joint<br />
APL<br />
BPL<br />
Baran 87.0 13.0 90.1 9.9<br />
Churu 79.9 20.1 95.2 4.8<br />
Dausa 77.8 22.2 87.3 12.7<br />
Dholpur 84.5 15.5 92.9 7.1<br />
Jhalawar 73.5 26.5 97.1 2.9<br />
Rajsamand 88.5 11.5 95.6 4.4<br />
Tonk 74.2 25.8 82.4 17.6<br />
Total 81.3 18.7 91.6 8.4<br />
Type <strong>of</strong> Household<br />
Majority <strong>of</strong> APL and BPL households are male headed households, though Churu has 13<br />
percent women headed households (APL category) and in case <strong>of</strong> BPL households excepting<br />
Baran o<strong>the</strong>r districts have 10 percent or more households that women headed; highest<br />
proportion coming from Tonk (17.6%)(table 3.3).<br />
Table 3.3: Type <strong>of</strong> Household (headed)<br />
<strong>District</strong> Male Female Differently Male Female Differently<br />
APL<br />
BPL<br />
Baran 92.5 6.2 1.2 92.7 5.1 2.2<br />
Churu 87.9 12.1 83.1 16.1 0.8<br />
66