Impact Assessment of the District Poverty Initiative Project Rajasthan
Impact Assessment of the District Poverty Initiative Project Rajasthan
Impact Assessment of the District Poverty Initiative Project Rajasthan
Create successful ePaper yourself
Turn your PDF publications into a flip-book with our unique Google optimized e-Paper software.
CIG Member Households<br />
< 5 19 13 4 2 11 49<br />
% 65.5 32.5 17.4 3.7 78.6 30.6<br />
5-10 9 19 6 8 2 44<br />
% 31.0 47.5 26.1 14.8 14.3 27.5<br />
10+ 1 8 13 44 1 67<br />
% 3.4 20.0 56.5 81.5 7.1 41.9<br />
Total 29 40 23 54 14 160<br />
Mean Rs. 4616 7775 12600 22357 3886 12477<br />
NoN-CIG Member Households<br />
< 5 32 9 2 8 7 58<br />
% 76.2 31.0 11.8 11.9 100 35.8<br />
5- 10 7 9 7 9 32<br />
% 16.7 31.0 41.2 13.4 19.8<br />
10 + 3 11 8 50 72<br />
% 7.1 37.9 47.1 74.6 44.4<br />
Total 42 29 17 67 7 162<br />
Mean Rs. 4390 10338 10129 18709 2586 11901<br />
-----------------------------------------------------------------------------------<br />
Health Awareness<br />
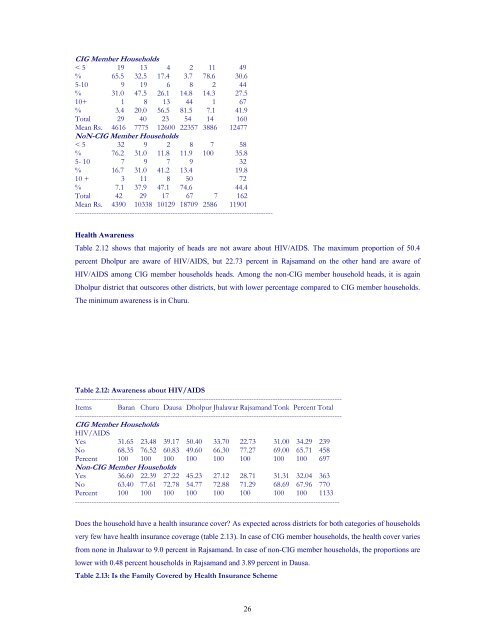
Table 2.12 shows that majority <strong>of</strong> heads are not aware about HIV/AIDS. The maximum proportion <strong>of</strong> 50.4<br />
percent Dholpur are aware <strong>of</strong> HIV/AIDS, but 22.73 percent in Rajsamand on <strong>the</strong> o<strong>the</strong>r hand are aware <strong>of</strong><br />
HIV/AIDS among CIG member households heads. Among <strong>the</strong> non-CIG member household heads, it is again<br />
Dholpur district that outscores o<strong>the</strong>r districts, but with lower percentage compared to CIG member households.<br />
The minimum awareness is in Churu.<br />
Table 2.12: Awareness about HIV/AIDS<br />
----------------------------------------------------------------------------------------------------------------<br />
Items Baran Churu Dausa Dholpur Jhalawar Rajsamand Tonk Percent Total<br />
----------------------------------------------------------------------------------------------------------------<br />
CIG Member Households<br />
HIV/AIDS<br />
Yes 31.65 23.48 39.17 50.40 33.70 22.73 31.00 34.29 239<br />
No 68.35 76.52 60.83 49.60 66.30 77.27 69.00 65.71 458<br />
Percent 100 100 100 100 100 100 100 100 697<br />
Non-CIG Member Households<br />
Yes 36.60 22.39 27.22 45.23 27.12 28.71 31.31 32.04 363<br />
No 63.40 77.61 72.78 54.77 72.88 71.29 68.69 67.96 770<br />
Percent 100 100 100 100 100 100 100 100 1133<br />
---------------------------------------------------------------------------------------------------------------<br />
Does <strong>the</strong> household have a health insurance cover As expected across districts for both categories <strong>of</strong> households<br />
very few have health insurance coverage (table 2.13). In case <strong>of</strong> CIG member households, <strong>the</strong> health cover varies<br />
from none in Jhalawar to 9.0 percent in Rajsamand. In case <strong>of</strong> non-CIG member households, <strong>the</strong> proportions are<br />
lower with 0.48 percent households in Rajsamand and 3.89 percent in Dausa.<br />
Table 2.13: Is <strong>the</strong> Family Covered by Health Insurance Scheme<br />
26


