Impact Assessment of the District Poverty Initiative Project Rajasthan
Impact Assessment of the District Poverty Initiative Project Rajasthan
Impact Assessment of the District Poverty Initiative Project Rajasthan

You also want an ePaper? Increase the reach of your titles
YUMPU automatically turns print PDFs into web optimized ePapers that Google loves.
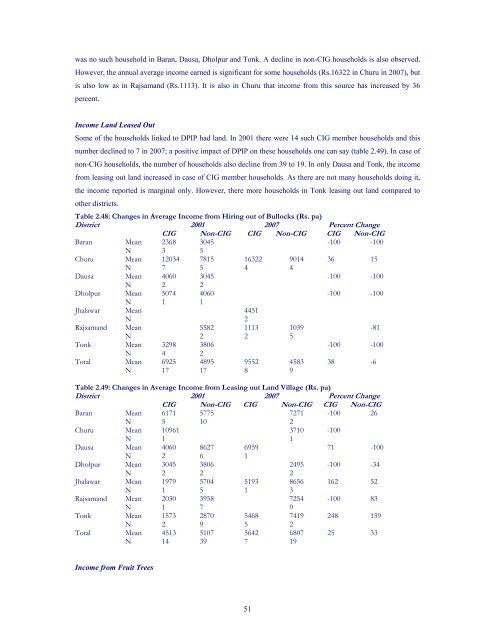
was no such household in Baran, Dausa, Dholpur and Tonk. A decline in non-CIG households is also observed.<br />
However, <strong>the</strong> annual average income earned is significant for some households (Rs.16322 in Churu in 2007), but<br />
is also low as in Rajsamand (Rs.1113). It is also in Churu that income from this source has increased by 36<br />
percent.<br />
Income Land Leased Out<br />
Some <strong>of</strong> <strong>the</strong> households linked to DPIP had land. In 2001 <strong>the</strong>re were 14 such CIG member households and this<br />
number declined to 7 in 2007; a positive impact <strong>of</strong> DPIP on <strong>the</strong>se households one can say (table 2.49). In case <strong>of</strong><br />
non-CIG households, <strong>the</strong> number <strong>of</strong> households also decline from 39 to 19. In only Dausa and Tonk, <strong>the</strong> income<br />
from leasing out land increased in case <strong>of</strong> CIG member households. As <strong>the</strong>re are not many households doing it,<br />
<strong>the</strong> income reported is marginal only. However, <strong>the</strong>re more households in Tonk leasing out land compared to<br />
o<strong>the</strong>r districts.<br />
Table 2.48: Changes in Average Income from Hiring out <strong>of</strong> Bullocks (Rs. pa)<br />
<strong>District</strong> 2001 2007 Percent Change<br />
CIG Non-CIG CIG Non-CIG CIG Non-CIG<br />
Baran Mean 2368 3045 -100 -100<br />
N 3 5<br />
Churu Mean 12034 7815 16322 9014 36 15<br />
N 7 5 4 4<br />
Dausa Mean 4060 3045 -100 -100<br />
N 2 2<br />
Dholpur Mean 5074 4060 -100 -100<br />
N 1 1<br />
Jhalawar Mean 4451<br />
N 2<br />
Rajsamand Mean 5582 1113 1039 -81<br />
N 2 2 5<br />
Tonk Mean 3298 3806 -100 -100<br />
N 4 2<br />
Total Mean 6925 4895 9552 4583 38 -6<br />
N 17 17 8 9<br />
Table 2.49: Changes in Average Income from Leasing out Land Village (Rs. pa)<br />
<strong>District</strong> 2001 2007 Percent Change<br />
CIG Non-CIG CIG Non-CIG CIG Non-CIG<br />
Baran Mean 6171 5775 7271 -100 26<br />
N 5 10 2<br />
Churu Mean 10961 3710 -100<br />
N 1 1<br />
Dausa Mean 4060 8627 6959 71 -100<br />
N 2 6 1<br />
Dholpur Mean 3045 3806 2495 -100 -34<br />
N 2 2 2<br />
Jhalawar Mean 1979 5704 5193 8656 162 52<br />
N 1 5 1 3<br />
Rajsamand Mean 2030 3958 7254 -100 83<br />
N 1 7 9<br />
Tonk Mean 1573 2870 5468 7419 248 159<br />
N 2 9 5 2<br />
Total Mean 4513 5107 5642 6807 25 33<br />
N 14 39 7 19<br />
Income from Fruit Trees<br />
51