Impact Assessment of the District Poverty Initiative Project Rajasthan
Impact Assessment of the District Poverty Initiative Project Rajasthan
Impact Assessment of the District Poverty Initiative Project Rajasthan

You also want an ePaper? Increase the reach of your titles
YUMPU automatically turns print PDFs into web optimized ePapers that Google loves.
NON-CIG Member Households<br />
Nuclear 88.14 97.01 88.33 91.46 96.61 95.69 81.82 91.53 1037<br />
Joint 11.86 2.99 11.67 8.54 3.39 4.31 18.18 8.47 96<br />
Percent 100 100 100 100 100 100 100 100 1133<br />
Household Type<br />
CIG Member Households<br />
Man 92.41 86.96 86.67 89.60 93.48 83.33 85.00 88.24 615<br />
Women 6.33 13.04 11.67 10.40 5.43 16.67 15.00 11.19 78<br />
Differently 1.27 1.67 1.09 0.57 4<br />
Percent 100 100 100 100 100 100 100 100 697<br />
Non-CIG Member Households<br />
Man 92.78 79.85 85.00 88.94 86.44 84.69 77.78 85.88 973<br />
Women 4.64 18.66 13.89 10.55 12.71 13.88 20.20 12.71 144<br />
Differently 2.58 1.49 1.11 0.50 0.85 1.44 2.02 1.41 16<br />
Percent 100 100 100 100 100 100 100 100 1133<br />
----------------------------------------------------------------------------------------------------------------<br />
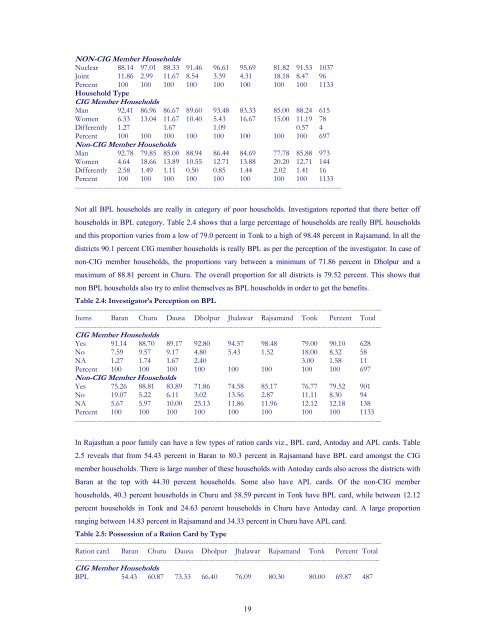
Not all BPL households are really in category <strong>of</strong> poor households. Investigators reported that <strong>the</strong>re better <strong>of</strong>f<br />
households in BPL category. Table 2.4 shows that a large percentage <strong>of</strong> households are really BPL households<br />
and this proportion varies from a low <strong>of</strong> 79.0 percent in Tonk to a high <strong>of</strong> 98.48 percent in Rajsamand. In all <strong>the</strong><br />
districts 90.1 percent CIG member households is really BPL as per <strong>the</strong> perception <strong>of</strong> <strong>the</strong> investigator. In case <strong>of</strong><br />
non-CIG member households, <strong>the</strong> proportions vary between a minimum <strong>of</strong> 71.86 percent in Dholpur and a<br />
maximum <strong>of</strong> 88.81 percent in Churu. The overall proportion for all districts is 79.52 percent. This shows that<br />
non BPL households also try to enlist <strong>the</strong>mselves as BPL households in order to get <strong>the</strong> benefits.<br />
Table 2.4: Investigator’s Perception on BPL<br />
---------------------------------------------------------------------------------------------------------------------------------<br />
Items Baran Churu Dausa Dholpur Jhalawar Rajsamand Tonk Percent Total<br />
---------------------------------------------------------------------------------------------------------------------------------<br />
CIG Member Households<br />
Yes 91.14 88.70 89.17 92.80 94.57 98.48 79.00 90.10 628<br />
No 7.59 9.57 9.17 4.80 5.43 1.52 18.00 8.32 58<br />
NA 1.27 1.74 1.67 2.40 3.00 1.58 11<br />
Percent 100 100 100 100 100 100 100 100 697<br />
Non-CIG Member Households<br />
Yes 75.26 88.81 83.89 71.86 74.58 85.17 76.77 79.52 901<br />
No 19.07 5.22 6.11 3.02 13.56 2.87 11.11 8.30 94<br />
NA 5.67 5.97 10.00 25.13 11.86 11.96 12.12 12.18 138<br />
Percent 100 100 100 100 100 100 100 100 1133<br />
---------------------------------------------------------------------------------------------------------------------------------<br />
In <strong>Rajasthan</strong> a poor family can have a few types <strong>of</strong> ration cards viz., BPL card, Antoday and APL cards. Table<br />
2.5 reveals that from 54.43 percent in Baran to 80.3 percent in Rajsamand have BPL card amongst <strong>the</strong> CIG<br />
member households. There is large number <strong>of</strong> <strong>the</strong>se households with Antoday cards also across <strong>the</strong> districts with<br />
Baran at <strong>the</strong> top with 44.30 percent households. Some also have APL cards. Of <strong>the</strong> non-CIG member<br />
households, 40.3 percent households in Churu and 58.59 percent in Tonk have BPL card, while between 12.12<br />
percent households in Tonk and 24.63 percent households in Churu have Antoday card. A large proportion<br />
ranging between 14.83 percent in Rajsamand and 34.33 percent in Churu have APL card.<br />
Table 2.5: Possession <strong>of</strong> a Ration Card by Type<br />
---------------------------------------------------------------------------------------------------------------------------------<br />
Ration card Baran Churu Dausa Dholpur Jhalawar Rajsamand Tonk Percent Total<br />
--------------------------------------------------------------------------------------------------------------------------------<br />
CIG Member Households<br />
BPL 54.43 60.87 73.33 66.40 76.09 80.30 80.00 69.87 487<br />
19