Impact Assessment of the District Poverty Initiative Project Rajasthan
Impact Assessment of the District Poverty Initiative Project Rajasthan
Impact Assessment of the District Poverty Initiative Project Rajasthan

Create successful ePaper yourself
Turn your PDF publications into a flip-book with our unique Google optimized e-Paper software.
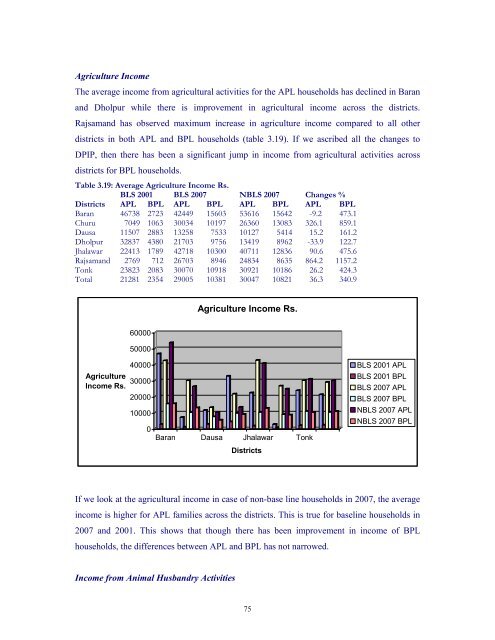
Agriculture Income<br />
The average income from agricultural activities for <strong>the</strong> APL households has declined in Baran<br />
and Dholpur while <strong>the</strong>re is improvement in agricultural income across <strong>the</strong> districts.<br />
Rajsamand has observed maximum increase in agriculture income compared to all o<strong>the</strong>r<br />
districts in both APL and BPL households (table 3.19). If we ascribed all <strong>the</strong> changes to<br />
DPIP, <strong>the</strong>n <strong>the</strong>re has been a significant jump in income from agricultural activities across<br />
districts for BPL households.<br />
Table 3.19: Average Agriculture Income Rs.<br />
BLS 2001 BLS 2007 NBLS 2007 Changes %<br />
<strong>District</strong>s APL BPL APL BPL APL BPL APL BPL<br />
Baran 46738 2723 42449 15603 53616 15642 -9.2 473.1<br />
Churu 7049 1063 30034 10197 26360 13083 326.1 859.1<br />
Dausa 11507 2883 13258 7533 10127 5414 15.2 161.2<br />
Dholpur 32837 4380 21703 9756 13419 8962 -33.9 122.7<br />
Jhalawar 22413 1789 42718 10300 40711 12836 90.6 475.6<br />
Rajsamand 2769 712 26703 8946 24834 8635 864.2 1157.2<br />
Tonk 23823 2083 30070 10918 30921 10186 26.2 424.3<br />
Total 21281 2354 29005 10381 30047 10821 36.3 340.9<br />
Agriculture Income Rs.<br />
60000<br />
50000<br />
Agriculture<br />
Income Rs.<br />
40000<br />
30000<br />
20000<br />
10000<br />
0<br />
Baran Dausa Jhalawar Tonk<br />
<strong>District</strong>s<br />
BLS 2001 APL<br />
BLS 2001 BPL<br />
BLS 2007 APL<br />
BLS 2007 BPL<br />
NBLS 2007 APL<br />
NBLS 2007 BPL<br />
If we look at <strong>the</strong> agricultural income in case <strong>of</strong> non-base line households in 2007, <strong>the</strong> average<br />
income is higher for APL families across <strong>the</strong> districts. This is true for baseline households in<br />
2007 and 2001. This shows that though <strong>the</strong>re has been improvement in income <strong>of</strong> BPL<br />
households, <strong>the</strong> differences between APL and BPL has not narrowed.<br />
Income from Animal Husbandry Activities<br />
75