Impact Assessment of the District Poverty Initiative Project Rajasthan
Impact Assessment of the District Poverty Initiative Project Rajasthan
Impact Assessment of the District Poverty Initiative Project Rajasthan
You also want an ePaper? Increase the reach of your titles
YUMPU automatically turns print PDFs into web optimized ePapers that Google loves.
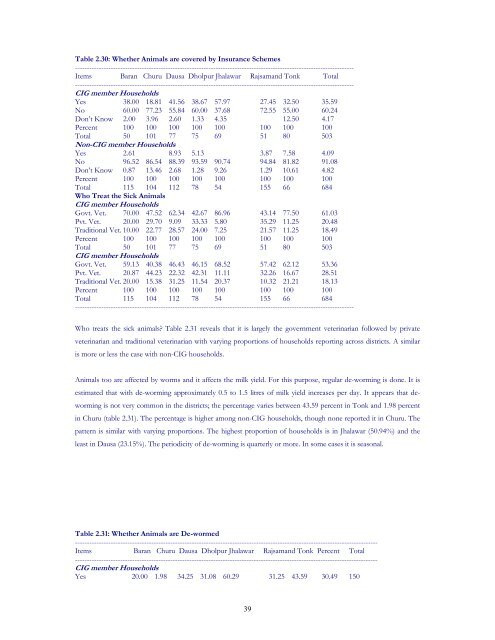
Table 2.30: Whe<strong>the</strong>r Animals are covered by Insurance Schemes<br />
---------------------------------------------------------------------------------------------------------------------<br />
Items Baran Churu Dausa Dholpur Jhalawar Rajsamand Tonk Total<br />
---------------------------------------------------------------------------------------------------------------------<br />
CIG member Households<br />
Yes 38.00 18.81 41.56 38.67 57.97 27.45 32.50 35.59<br />
No 60.00 77.23 55.84 60.00 37.68 72.55 55.00 60.24<br />
Don’t Know 2.00 3.96 2.60 1.33 4.35 12.50 4.17<br />
Percent 100 100 100 100 100 100 100 100<br />
Total 50 101 77 75 69 51 80 503<br />
Non-CIG member Households<br />
Yes 2.61 8.93 5.13 3.87 7.58 4.09<br />
No 96.52 86.54 88.39 93.59 90.74 94.84 81.82 91.08<br />
Don’t Know 0.87 13.46 2.68 1.28 9.26 1.29 10.61 4.82<br />
Percent 100 100 100 100 100 100 100 100<br />
Total 115 104 112 78 54 155 66 684<br />
Who Treat <strong>the</strong> Sick Animals<br />
CIG member Households<br />
Govt. Vet. 70.00 47.52 62.34 42.67 86.96 43.14 77.50 61.03<br />
Pvt. Vet. 20.00 29.70 9.09 33.33 5.80 35.29 11.25 20.48<br />
Traditional Vet. 10.00 22.77 28.57 24.00 7.25 21.57 11.25 18.49<br />
Percent 100 100 100 100 100 100 100 100<br />
Total 50 101 77 75 69 51 80 503<br />
CIG member Households<br />
Govt. Vet. 59.13 40.38 46.43 46.15 68.52 57.42 62.12 53.36<br />
Pvt. Vet. 20.87 44.23 22.32 42.31 11.11 32.26 16.67 28.51<br />
Traditional Vet. 20.00 15.38 31.25 11.54 20.37 10.32 21.21 18.13<br />
Percent 100 100 100 100 100 100 100 100<br />
Total 115 104 112 78 54 155 66 684<br />
---------------------------------------------------------------------------------------------------------------------<br />
Who treats <strong>the</strong> sick animals Table 2.31 reveals that it is largely <strong>the</strong> government veterinarian followed by private<br />
veterinarian and traditional veterinarian with varying proportions <strong>of</strong> households reporting across districts. A similar<br />
is more or less <strong>the</strong> case with non-CIG households.<br />
Animals too are affected by worms and it affects <strong>the</strong> milk yield. For this purpose, regular de-worming is done. It is<br />
estimated that with de-worming approximately 0.5 to 1.5 litres <strong>of</strong> milk yield increases per day. It appears that deworming<br />
is not very common in <strong>the</strong> districts; <strong>the</strong> percentage varies between 43.59 percent in Tonk and 1.98 percent<br />
in Churu (table 2.31). The percentage is higher among non-CIG households, though none reported it in Churu. The<br />
pattern is similar with varying proportions. The highest proportion <strong>of</strong> households is in Jhalawar (50.94%) and <strong>the</strong><br />
least in Dausa (23.15%). The periodicity <strong>of</strong> de-worming is quarterly or more. In some cases it is seasonal.<br />
Table 2.31: Whe<strong>the</strong>r Animals are De-wormed<br />
-------------------------------------------------------------------------------------------------------------------------------<br />
Items Baran Churu Dausa Dholpur Jhalawar Rajsamand Tonk Percent Total<br />
-------------------------------------------------------------------------------------------------------------------------------<br />
CIG member Households<br />
Yes 20.00 1.98 34.25 31.08 60.29 31.25 43.59 30.49 150<br />
39


