Impact Assessment of the District Poverty Initiative Project Rajasthan
Impact Assessment of the District Poverty Initiative Project Rajasthan
Impact Assessment of the District Poverty Initiative Project Rajasthan

You also want an ePaper? Increase the reach of your titles
YUMPU automatically turns print PDFs into web optimized ePapers that Google loves.
Months<br />
Baran Churu Dausa Dholpur Jhalawar Rajsamand Tonk Percent Total<br />
------------------------------------------------------------------------------------------------------------------------------<br />
CIG member Households<br />
1 4.55 2.27 2.00 1.11 5<br />
2 10.23 3.90 2.74 6.00 6.15 4.68 21<br />
3 4.55 4.55 5.19 2.74 3.85 8.00 9.23 5.35 24<br />
4 17.05 9.09 4.11 3.85 4.00 4.62 7.13 32<br />
5 4.55 5.68 3.90 2.74 1.92 4.00 3.08 3.79 17<br />
6 4.55 12.50 23.38 9.59 3.85 12.31 10.69 48<br />
7 10.23 1.30 8.22 3.08 4.01 18<br />
8 4.55 3.90 1.37 1.92 4.00 6.15 3.34 15<br />
9 1.14 0.22 1<br />
10 4.55 3.41 7.79 23.08 6.00 4.62 6.46 29<br />
11 2.27 1.30 1.37 0.67 3<br />
12 75.00 28.41 40.26 67.12 61.54 66.00 50.77 52.56 236<br />
Percent 100 100 100 100 100 100 100 100 449<br />
Total 44 88 77 73 52 50 65 449<br />
Non-CIG member Households<br />
1 1.00 1.75 1.04 0.65 1.89 0.90 6<br />
2 1.00 7.02 4.95 2.60 5.66 3.17 21<br />
3 10.53 7.29 1.98 2.22 0.65 5.66 3.92 26<br />
4 1.00 10.53 6.25 17.82 11.11 3.90 7.55 7.84 52<br />
5 13.16 6.25 2.97 0.00 3.90 7.55 5.13 34<br />
6 5.00 10.53 9.38 6.93 4.44 4.55 5.66 6.79 45<br />
7 1.00 7.02 5.21 3.96 0.00 1.30 3.77 3.32 22<br />
8 3.00 6.14 5.21 1.98 4.44 2.60 9.43 4.22 28<br />
9 1.75 1.04 0.99 4.55 1.66 11<br />
10 1.00 2.63 4.17 0.99 24.44 6.49 5.66 4.98 33<br />
11 0.65 0.15 1<br />
12 87.00 28.95 54.17 57.43 53.33 68.18 47.17 57.92 384<br />
Percent 100 100 100 100 100 100 100 100 663<br />
Total 100 114 96 101 45 154 53 663<br />
--------------------------------------------------------------------------------------------------------------------------------<br />
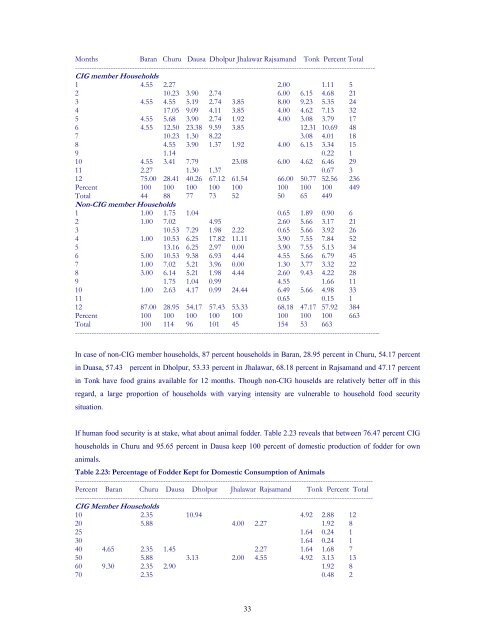
In case <strong>of</strong> non-CIG member households, 87 percent households in Baran, 28.95 percent in Churu, 54.17 percent<br />
in Duasa, 57.43 percent in Dholpur, 53.33 percent in Jhalawar, 68.18 percent in Rajsamand and 47.17 percent<br />
in Tonk have food grains available for 12 months. Though non-CIG houselds are relatively better <strong>of</strong>f in this<br />
regard, a large proportion <strong>of</strong> households with varying intensity are vulnerable to household food security<br />
situation.<br />
If human food security is at stake, what about animal fodder. Table 2.23 reveals that between 76.47 percent CIG<br />
households in Churu and 95.65 percent in Dausa keep 100 percent <strong>of</strong> domestic production <strong>of</strong> fodder for own<br />
animals.<br />
Table 2.23: Percentage <strong>of</strong> Fodder Kept for Domestic Consumption <strong>of</strong> Animals<br />
-----------------------------------------------------------------------------------------------------------------------------<br />
Percent Baran Churu Dausa Dholpur Jhalawar Rajsamand Tonk Percent Total<br />
-----------------------------------------------------------------------------------------------------------------------------<br />
CIG Member Households<br />
10 2.35 10.94 4.92 2.88 12<br />
20 5.88 4.00 2.27 1.92 8<br />
25 1.64 0.24 1<br />
30 1.64 0.24 1<br />
40 4.65 2.35 1.45 2.27 1.64 1.68 7<br />
50 5.88 3.13 2.00 4.55 4.92 3.13 13<br />
60 9.30 2.35 2.90 1.92 8<br />
70 2.35 0.48 2<br />
33