Impact Assessment of the District Poverty Initiative Project Rajasthan
Impact Assessment of the District Poverty Initiative Project Rajasthan
Impact Assessment of the District Poverty Initiative Project Rajasthan

Create successful ePaper yourself
Turn your PDF publications into a flip-book with our unique Google optimized e-Paper software.
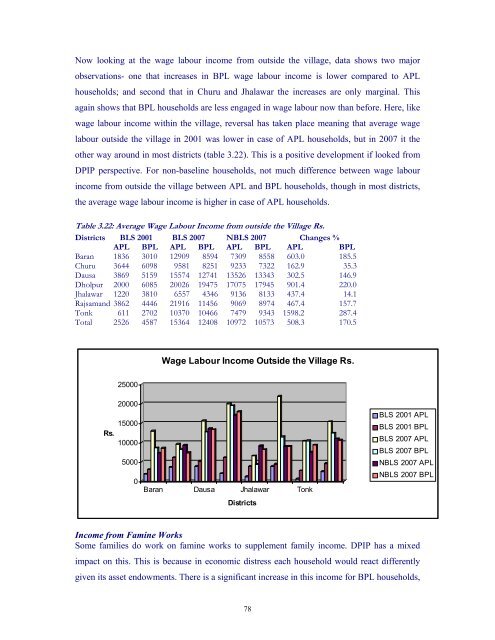
Now looking at <strong>the</strong> wage labour income from outside <strong>the</strong> village, data shows two major<br />
observations- one that increases in BPL wage labour income is lower compared to APL<br />
households; and second that in Churu and Jhalawar <strong>the</strong> increases are only marginal. This<br />
again shows that BPL households are less engaged in wage labour now than before. Here, like<br />
wage labour income within <strong>the</strong> village, reversal has taken place meaning that average wage<br />
labour outside <strong>the</strong> village in 2001 was lower in case <strong>of</strong> APL households, but in 2007 it <strong>the</strong><br />
o<strong>the</strong>r way around in most districts (table 3.22). This is a positive development if looked from<br />
DPIP perspective. For non-baseline households, not much difference between wage labour<br />
income from outside <strong>the</strong> village between APL and BPL households, though in most districts,<br />
<strong>the</strong> average wage labour income is higher in case <strong>of</strong> APL households.<br />
Table 3.22: Average Wage Labour Income from outside <strong>the</strong> Village Rs.<br />
<strong>District</strong>s BLS 2001 BLS 2007 NBLS 2007 Changes %<br />
APL BPL APL BPL APL BPL APL BPL<br />
Baran 1836 3010 12909 8594 7309 8558 603.0 185.5<br />
Churu 3644 6098 9581 8251 9233 7322 162.9 35.3<br />
Dausa 3869 5159 15574 12741 13526 13343 302.5 146.9<br />
Dholpur 2000 6085 20026 19475 17075 17945 901.4 220.0<br />
Jhalawar 1220 3810 6557 4346 9136 8133 437.4 14.1<br />
Rajsamand 3862 4446 21916 11456 9069 8974 467.4 157.7<br />
Tonk 611 2702 10370 10466 7479 9343 1598.2 287.4<br />
Total 2526 4587 15364 12408 10972 10573 508.3 170.5<br />
Wage Labour Income Outside <strong>the</strong> Village Rs.<br />
25000<br />
Rs.<br />
20000<br />
15000<br />
10000<br />
5000<br />
0<br />
Baran Dausa Jhalawar Tonk<br />
<strong>District</strong>s<br />
BLS 2001 APL<br />
BLS 2001 BPL<br />
BLS 2007 APL<br />
BLS 2007 BPL<br />
NBLS 2007 APL<br />
NBLS 2007 BPL<br />
Income from Famine Works<br />
Some families do work on famine works to supplement family income. DPIP has a mixed<br />
impact on this. This is because in economic distress each household would react differently<br />
given its asset endowments. There is a significant increase in this income for BPL households,<br />
78