Impact Assessment of the District Poverty Initiative Project Rajasthan
Impact Assessment of the District Poverty Initiative Project Rajasthan
Impact Assessment of the District Poverty Initiative Project Rajasthan

You also want an ePaper? Increase the reach of your titles
YUMPU automatically turns print PDFs into web optimized ePapers that Google loves.
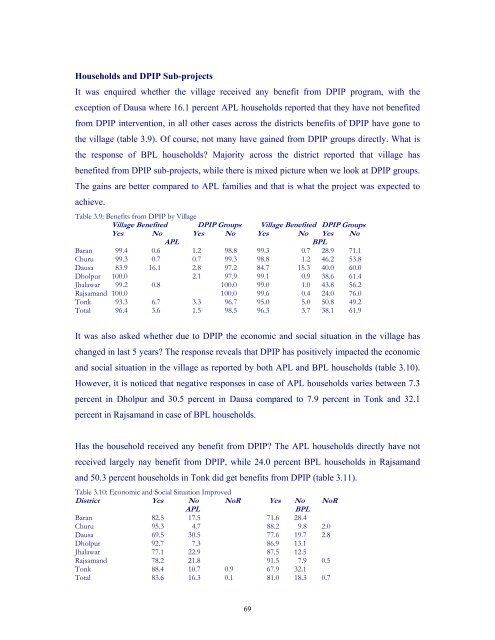
Households and DPIP Sub-projects<br />
It was enquired whe<strong>the</strong>r <strong>the</strong> village received any benefit from DPIP program, with <strong>the</strong><br />
exception <strong>of</strong> Dausa where 16.1 percent APL households reported that <strong>the</strong>y have not benefited<br />
from DPIP intervention, in all o<strong>the</strong>r cases across <strong>the</strong> districts benefits <strong>of</strong> DPIP have gone to<br />
<strong>the</strong> village (table 3.9). Of course, not many have gained from DPIP groups directly. What is<br />
<strong>the</strong> response <strong>of</strong> BPL households Majority across <strong>the</strong> district reported that village has<br />
benefited from DPIP sub-projects, while <strong>the</strong>re is mixed picture when we look at DPIP groups.<br />
The gains are better compared to APL families and that is what <strong>the</strong> project was expected to<br />
achieve.<br />
Table 3.9: Benefits from DPIP by Village<br />
Village Benefited DPIP Groups Village Benefited DPIP Groups<br />
Yes No Yes No Yes No Yes No<br />
APL<br />
BPL<br />
Baran 99.4 0.6 1.2 98.8 99.3 0.7 28.9 71.1<br />
Churu 99.3 0.7 0.7 99.3 98.8 1.2 46.2 53.8<br />
Dausa 83.9 16.1 2.8 97.2 84.7 15.3 40.0 60.0<br />
Dholpur 100.0 2.1 97.9 99.1 0.9 38.6 61.4<br />
Jhalawar 99.2 0.8 100.0 99.0 1.0 43.8 56.2<br />
Rajsamand 100.0 100.0 99.6 0.4 24.0 76.0<br />
Tonk 93.3 6.7 3.3 96.7 95.0 5.0 50.8 49.2<br />
Total 96.4 3.6 1.5 98.5 96.3 3.7 38.1 61.9<br />
It was also asked whe<strong>the</strong>r due to DPIP <strong>the</strong> economic and social situation in <strong>the</strong> village has<br />
changed in last 5 years The response reveals that DPIP has positively impacted <strong>the</strong> economic<br />
and social situation in <strong>the</strong> village as reported by both APL and BPL households (table 3.10).<br />
However, it is noticed that negative responses in case <strong>of</strong> APL households varies between 7.3<br />
percent in Dholpur and 30.5 percent in Dausa compared to 7.9 percent in Tonk and 32.1<br />
percent in Rajsamand in case <strong>of</strong> BPL households.<br />
Has <strong>the</strong> household received any benefit from DPIP The APL households directly have not<br />
received largely nay benefit from DPIP, while 24.0 percent BPL households in Rajsamand<br />
and 50.3 percent households in Tonk did get benefits from DPIP (table 3.11).<br />
Table 3.10: Economic and Social Situation Improved<br />
<strong>District</strong> Yes No NoR Yes No NoR<br />
APL<br />
BPL<br />
Baran 82.5 17.5 71.6 28.4<br />
Churu 95.3 4.7 88.2 9.8 2.0<br />
Dausa 69.5 30.5 77.6 19.7 2.8<br />
Dholpur 92.7 7.3 86.9 13.1<br />
Jhalawar 77.1 22.9 87.5 12.5<br />
Rajsamand 78.2 21.8 91.5 7.9 0.5<br />
Tonk 88.4 10.7 0.9 67.9 32.1<br />
Total 83.6 16.3 0.1 81.0 18.3 0.7<br />
69