Impact Assessment of the District Poverty Initiative Project Rajasthan
Impact Assessment of the District Poverty Initiative Project Rajasthan
Impact Assessment of the District Poverty Initiative Project Rajasthan

You also want an ePaper? Increase the reach of your titles
YUMPU automatically turns print PDFs into web optimized ePapers that Google loves.
Holding Size (No.)<br />
35.00<br />
30.00<br />
25.00<br />
20.00<br />
Bighas<br />
15.00<br />
10.00<br />
5.00<br />
0.00<br />
Baran Dholpur Tonk<br />
<strong>District</strong>s<br />
BLS 2001 APL<br />
BLS 2001 BPL<br />
BLS 2007 APL<br />
BLS 2007 BPL<br />
NBLS 2007 APL<br />
NBLS 2007 BPL<br />
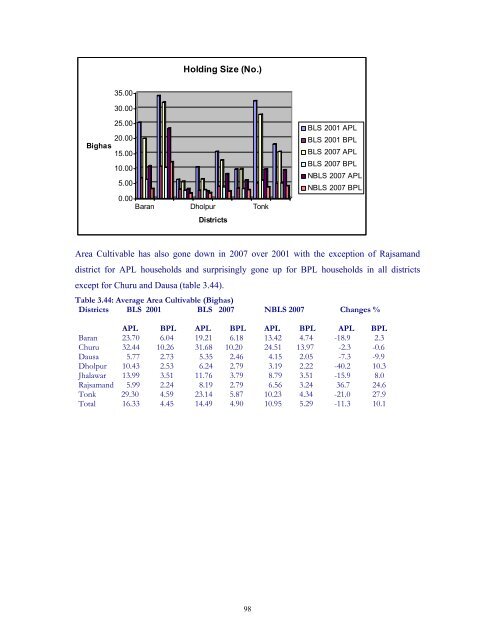
Area Cultivable has also gone down in 2007 over 2001 with <strong>the</strong> exception <strong>of</strong> Rajsamand<br />
district for APL households and surprisingly gone up for BPL households in all districts<br />
except for Churu and Dausa (table 3.44).<br />
Table 3.44: Average Area Cultivable (Bighas)<br />
<strong>District</strong>s BLS 2001 BLS 2007 NBLS 2007 Changes %<br />
APL BPL APL BPL APL BPL APL BPL<br />
Baran 23.70 6.04 19.21 6.18 13.42 4.74 -18.9 2.3<br />
Churu 32.44 10.26 31.68 10.20 24.51 13.97 -2.3 -0.6<br />
Dausa 5.77 2.73 5.35 2.46 4.15 2.05 -7.3 -9.9<br />
Dholpur 10.43 2.53 6.24 2.79 3.19 2.22 -40.2 10.3<br />
Jhalawar 13.99 3.51 11.76 3.79 8.79 3.51 -15.9 8.0<br />
Rajsamand 5.99 2.24 8.19 2.79 6.56 3.24 36.7 24.6<br />
Tonk 29.30 4.59 23.14 5.87 10.23 4.34 -21.0 27.9<br />
Total 16.33 4.45 14.49 4.90 10.95 5.29 -11.3 10.1<br />
98