Impact Assessment of the District Poverty Initiative Project Rajasthan
Impact Assessment of the District Poverty Initiative Project Rajasthan
Impact Assessment of the District Poverty Initiative Project Rajasthan

Create successful ePaper yourself
Turn your PDF publications into a flip-book with our unique Google optimized e-Paper software.
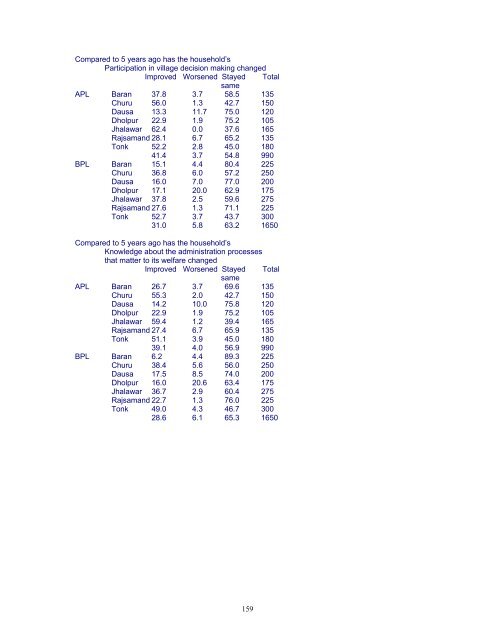
Compared to 5 years ago has <strong>the</strong> household’s<br />
Participation in village decision making changed<br />
Improved Worsened Stayed Total<br />
same<br />
APL Baran 37.8 3.7 58.5 135<br />
Churu 56.0 1.3 42.7 150<br />
Dausa 13.3 11.7 75.0 120<br />
Dholpur 22.9 1.9 75.2 105<br />
Jhalawar 62.4 0.0 37.6 165<br />
Rajsamand 28.1 6.7 65.2 135<br />
Tonk 52.2 2.8 45.0 180<br />
41.4 3.7 54.8 990<br />
BPL Baran 15.1 4.4 80.4 225<br />
Churu 36.8 6.0 57.2 250<br />
Dausa 16.0 7.0 77.0 200<br />
Dholpur 17.1 20.0 62.9 175<br />
Jhalawar 37.8 2.5 59.6 275<br />
Rajsamand 27.6 1.3 71.1 225<br />
Tonk 52.7 3.7 43.7 300<br />
31.0 5.8 63.2 1650<br />
Compared to 5 years ago has <strong>the</strong> household’s<br />
Knowledge about <strong>the</strong> administration processes<br />
that matter to its welfare changed<br />
Improved Worsened Stayed Total<br />
same<br />
APL Baran 26.7 3.7 69.6 135<br />
Churu 55.3 2.0 42.7 150<br />
Dausa 14.2 10.0 75.8 120<br />
Dholpur 22.9 1.9 75.2 105<br />
Jhalawar 59.4 1.2 39.4 165<br />
Rajsamand 27.4 6.7 65.9 135<br />
Tonk 51.1 3.9 45.0 180<br />
39.1 4.0 56.9 990<br />
BPL Baran 6.2 4.4 89.3 225<br />
Churu 38.4 5.6 56.0 250<br />
Dausa 17.5 8.5 74.0 200<br />
Dholpur 16.0 20.6 63.4 175<br />
Jhalawar 36.7 2.9 60.4 275<br />
Rajsamand 22.7 1.3 76.0 225<br />
Tonk 49.0 4.3 46.7 300<br />
28.6 6.1 65.3 1650<br />
159