Impact Assessment of the District Poverty Initiative Project Rajasthan
Impact Assessment of the District Poverty Initiative Project Rajasthan
Impact Assessment of the District Poverty Initiative Project Rajasthan

Create successful ePaper yourself
Turn your PDF publications into a flip-book with our unique Google optimized e-Paper software.
75 1.64 0.24 1<br />
80 1.18 2.00 3.28 0.96 4<br />
90 1.18 1.56 0.48 2<br />
100 86.05 76.47 95.65 84.38 92.00 90.91 80.33 85.82 357<br />
Percent 100 100 100 100 100 100 100 100 416<br />
Total 43 85 69 64 50 44 61 416<br />
Non-CIG Member Households<br />
10 1.04 1.28 2.74 0.75 4.17 1.28 7<br />
11 2.08 0.18 1<br />
12 1.04 0.18 1<br />
19 1.28 0.18 1<br />
20 1.18 2.08 2.94 1.50 4.17 1.46 8<br />
25 1.37 0.18 1<br />
30 1.18 1.28 2.08 0.55 3<br />
35 1.04 0.18 1<br />
40 3.53 1.04 2.94 2.08 1.10 6<br />
50 2.35 4.17 2.56 8.22 2.94 3.01 4.17 3.84 21<br />
60 1.04 1.28 3.76 1.28 7<br />
70 2.08 1.28 1.37 0.75 0.91 5<br />
72 1.18 0.18 1<br />
75 2.35 0.37 2<br />
80 1.18 2.94 0.37 2<br />
90 0.75 0.18 1<br />
100 87.06 86.46 91.03 86.30 88.24 89.47 81.25 87.57 479<br />
Percent 100 100 100 100 100 100 100 100 547<br />
Total 85 96 78 73 34 133 48 547<br />
-----------------------------------------------------------------------------------------------------------------------------<br />
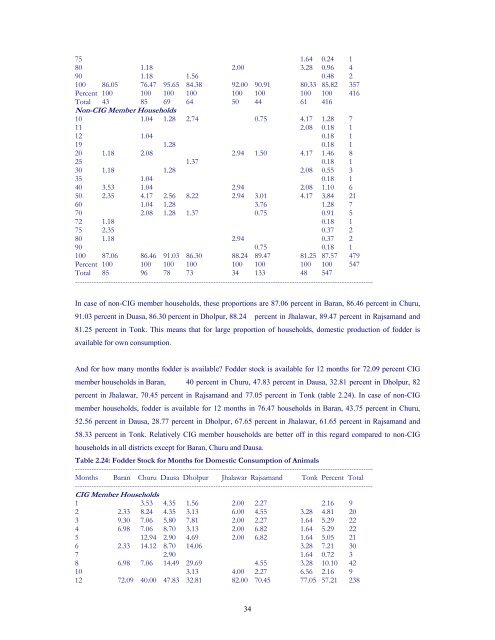
In case <strong>of</strong> non-CIG member households, <strong>the</strong>se proportions are 87.06 percent in Baran, 86.46 percent in Churu,<br />
91.03 percent in Duasa, 86.30 percent in Dholpur, 88.24 percent in Jhalawar, 89.47 percent in Rajsamand and<br />
81.25 percent in Tonk. This means that for large proportion <strong>of</strong> households, domestic production <strong>of</strong> fodder is<br />
available for own consumption.<br />
And for how many months fodder is available Fodder stock is available for 12 months for 72.09 percent CIG<br />
member households in Baran, 40 percent in Churu, 47.83 percent in Dausa, 32.81 percent in Dholpur, 82<br />
percent in Jhalawar, 70.45 percent in Rajsamand and 77.05 percent in Tonk (table 2.24). In case <strong>of</strong> non-CIG<br />
member households, fodder is available for 12 months in 76.47 households in Baran, 43.75 percent in Churu,<br />
52.56 percent in Dausa, 28.77 percent in Dholpur, 67.65 percent in Jhalawar, 61.65 percent in Rajsamand and<br />
58.33 percent in Tonk. Relatively CIG member households are better <strong>of</strong>f in this regard compared to non-CIG<br />
households in all districts except for Baran, Churu and Dausa.<br />
Table 2.24: Fodder Stock for Months for Domestic Consumption <strong>of</strong> Animals<br />
-----------------------------------------------------------------------------------------------------------------------------<br />
Months Baran Churu Dausa Dholpur Jhalawar Rajsamand Tonk Percent Total<br />
-----------------------------------------------------------------------------------------------------------------------------<br />
CIG Member Households<br />
1 3.53 4.35 1.56 2.00 2.27 2.16 9<br />
2 2.33 8.24 4.35 3.13 6.00 4.55 3.28 4.81 20<br />
3 9.30 7.06 5.80 7.81 2.00 2.27 1.64 5.29 22<br />
4 6.98 7.06 8.70 3.13 2.00 6.82 1.64 5.29 22<br />
5 12.94 2.90 4.69 2.00 6.82 1.64 5.05 21<br />
6 2.33 14.12 8.70 14.06 3.28 7.21 30<br />
7 2.90 1.64 0.72 3<br />
8 6.98 7.06 14.49 29.69 4.55 3.28 10.10 42<br />
10 3.13 4.00 2.27 6.56 2.16 9<br />
12 72.09 40.00 47.83 32.81 82.00 70.45 77.05 57.21 238<br />
34