Impact Assessment of the District Poverty Initiative Project Rajasthan
Impact Assessment of the District Poverty Initiative Project Rajasthan
Impact Assessment of the District Poverty Initiative Project Rajasthan

You also want an ePaper? Increase the reach of your titles
YUMPU automatically turns print PDFs into web optimized ePapers that Google loves.
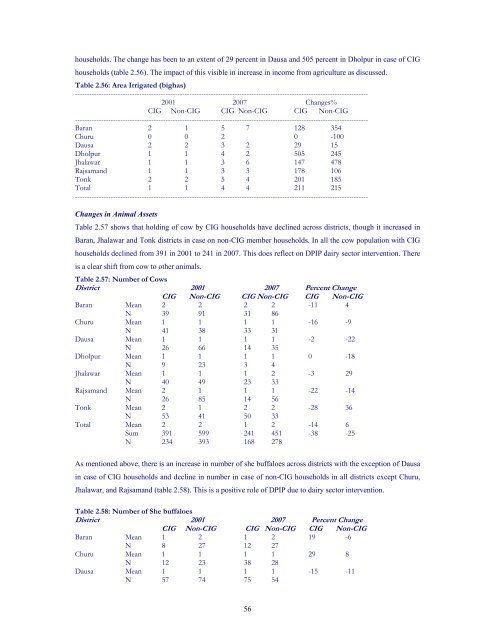
households. The change has been to an extent <strong>of</strong> 29 percent in Dausa and 505 percent in Dholpur in case <strong>of</strong> CIG<br />
households (table 2.56). The impact <strong>of</strong> this visible in increase in income from agriculture as discussed.<br />
Table 2.56: Area Irrigated (bighas)<br />
---------------------------------------------------------------------------------------------------------------------------<br />
2001 2007 Changes%<br />
CIG Non-CIG CIG Non-CIG CIG Non-CIG<br />
---------------------------------------------------------------------------------------------------------------------------<br />
Baran 2 1 5 7 128 354<br />
Churu 0 0 2 0 -100<br />
Dausa 2 2 3 2 29 15<br />
Dholpur 1 1 4 2 505 245<br />
Jhalawar 1 1 3 6 147 478<br />
Rajsamand 1 1 3 3 178 106<br />
Tonk 2 2 5 4 201 185<br />
Total 1 1 4 4 211 215<br />
---------------------------------------------------------------------------------------------------------------------------<br />
Changes in Animal Assets<br />
Table 2.57 shows that holding <strong>of</strong> cow by CIG households have declined across districts, though it increased in<br />
Baran, Jhalawar and Tonk districts in case on non-CIG member households. In all <strong>the</strong> cow population with CIG<br />
households declined from 391 in 2001 to 241 in 2007. This does reflect on DPIP dairy sector intervention. There<br />
is a clear shift from cow to o<strong>the</strong>r animals.<br />
Table 2.57: Number <strong>of</strong> Cows<br />
<strong>District</strong> 2001 2007 Percent Change<br />
CIG Non-CIG CIG Non-CIG CIG Non-CIG<br />
Baran Mean 2 2 2 2 -11 4<br />
N 39 91 31 86<br />
Churu Mean 1 1 1 1 -16 -9<br />
N 41 38 33 31<br />
Dausa Mean 1 1 1 1 -2 -22<br />
N 26 66 14 35<br />
Dholpur Mean 1 1 1 1 0 -18<br />
N 9 23 3 4<br />
Jhalawar Mean 1 1 1 2 -3 29<br />
N 40 49 23 33<br />
Rajsamand Mean 2 1 1 1 -22 -14<br />
N 26 85 14 56<br />
Tonk Mean 2 1 2 2 -28 36<br />
N 53 41 50 33<br />
Total Mean 2 2 1 2 -14 6<br />
Sum 391 599 241 451 -38 -25<br />
N 234 393 168 278<br />
As mentioned above, <strong>the</strong>re is an increase in number <strong>of</strong> she buffaloes across districts with <strong>the</strong> exception <strong>of</strong> Dausa<br />
in case <strong>of</strong> CIG households and decline in number in case <strong>of</strong> non-CIG households in all districts except Churu,<br />
Jhalawar, and Rajsamand (table 2.58). This is a positive role <strong>of</strong> DPIP due to dairy sector intervention.<br />
Table 2.58: Number <strong>of</strong> She buffaloes<br />
<strong>District</strong> 2001 2007 Percent Change<br />
CIG Non-CIG CIG Non-CIG CIG Non-CIG<br />
Baran Mean 1 2 1 2 19 -6<br />
N 8 27 12 27<br />
Churu Mean 1 1 1 1 29 8<br />
N 12 23 38 28<br />
Dausa Mean 1 1 1 1 -15 -11<br />
N 57 74 75 54<br />
56