Impact Assessment of the District Poverty Initiative Project Rajasthan
Impact Assessment of the District Poverty Initiative Project Rajasthan
Impact Assessment of the District Poverty Initiative Project Rajasthan

You also want an ePaper? Increase the reach of your titles
YUMPU automatically turns print PDFs into web optimized ePapers that Google loves.
Married 96.20 99.13 99.17 100 98.91 98.48 85.00 96.84 675<br />
Unmarried 0.87 0.83 1.09 1.52 1.00 0.72 5<br />
Widow 3.80 13.00 2.30 16<br />
Widower 1.00 0.14 1<br />
Percent 100 100 100 100 100 100 100 100 697<br />
Non-CIG Member Household<br />
Married 97.94 98.51 98.89 94.47 94.92 99.04 82.83 96.12 1089<br />
Unmarried 1.03 1.49 1.11 5.53 5.08 0.96 1.01 2.29 26<br />
Widow 0.52 12.12 1.15 13<br />
Widower 0.52 2.02 0.26 3<br />
Separated 2.02 0.18 2<br />
Percent 100 100 100 100 100 100 100 100 1133<br />
---------------------------------------------------------------------------------------------------------------------------------------<br />
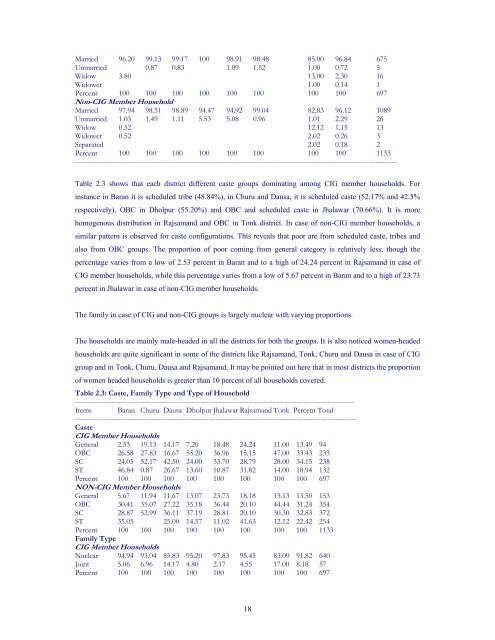
Table 2.3 shows that each district different caste groups dominating among CIG member households. For<br />
instance in Baran it is scheduled tribe (48.84%), in Churu and Dausa, it is scheduled caste (52.17% and 42.5%<br />
respectively), OBC in Dholpur (55.20%) and OBC and scheduled caste in Jhalawar (70.66%). It is more<br />
homogenous distribution in Rajsamand and OBC in Tonk district. In case <strong>of</strong> non-CIG member households, a<br />
similar pattern is observed for caste configurations. This reveals that poor are from scheduled caste, tribes and<br />
also from OBC groups. The proportion <strong>of</strong> poor coming from general category is relatively less, though <strong>the</strong><br />
percentage varies from a low <strong>of</strong> 2.53 percent in Baran and to a high <strong>of</strong> 24.24 percent in Rajsamand in case <strong>of</strong><br />
CIG member households, while this percentage varies from a low <strong>of</strong> 5.67 percent in Baran and to a high <strong>of</strong> 23.73<br />
percent in Jhalawar in case <strong>of</strong> non-CIG member households.<br />
The family in case <strong>of</strong> CIG and non-CIG groups is largely nuclear with varying proportions.<br />
The households are mainly male-headed in all <strong>the</strong> districts for both <strong>the</strong> groups. It is also noticed women-headed<br />
households are quite significant in some <strong>of</strong> <strong>the</strong> districts like Rajsamand, Tonk, Churu and Dausa in case <strong>of</strong> CIG<br />
group and in Tonk, Churu, Dausa and Rajsamand. It may be pointed out here that in most districts <strong>the</strong> proportion<br />
<strong>of</strong> women headed households is greater than 10 percent <strong>of</strong> all households covered.<br />
Table 2.3: Caste, Family Type and Type <strong>of</strong> Household<br />
---------------------------------------------------------------------------------------------------------------------<br />
Items Baran Churu Dausa Dholpur Jhalawar Rajsamand Tonk Percent Total<br />
----------------------------------------------------------------------------------------------------------------------<br />
Caste<br />
CIG Member Households<br />
General 2.53 19.13 14.17 7.20 18.48 24.24 11.00 13.49 94<br />
OBC 26.58 27.83 16.67 55.20 36.96 15.15 47.00 33.43 233<br />
SC 24.05 52.17 42.50 24.00 33.70 28.79 28.00 34.15 238<br />
ST 46.84 0.87 26.67 13.60 10.87 31.82 14.00 18.94 132<br />
Percent 100 100 100 100 100 100 100 100 697<br />
NON-CIG Member Households<br />
General 5.67 11.94 11.67 13.07 23.73 18.18 13.13 13.50 153<br />
OBC 30.41 35.07 27.22 35.18 36.44 20.10 44.44 31.24 354<br />
SC 28.87 52.99 36.11 37.19 28.81 20.10 30.30 32.83 372<br />
ST 35.05 25.00 14.57 11.02 41.63 12.12 22.42 254<br />
Percent 100 100 100 100 100 100 100 100 1133<br />
Family Type<br />
CIG Member Households<br />
Nuclear 94.94 93.04 85.83 95.20 97.83 95.45 83.00 91.82 640<br />
Joint 5.06 6.96 14.17 4.80 2.17 4.55 17.00 8.18 57<br />
Percent 100 100 100 100 100 100 100 100 697<br />
18