Impact Assessment of the District Poverty Initiative Project Rajasthan
Impact Assessment of the District Poverty Initiative Project Rajasthan
Impact Assessment of the District Poverty Initiative Project Rajasthan

Create successful ePaper yourself
Turn your PDF publications into a flip-book with our unique Google optimized e-Paper software.
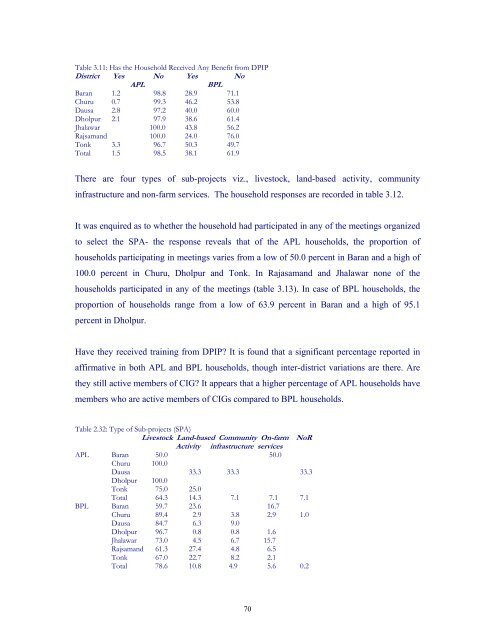
Table 3.11: Has <strong>the</strong> Household Received Any Benefit from DPIP<br />
<strong>District</strong> Yes No Yes No<br />
APL<br />
BPL<br />
Baran 1.2 98.8 28.9 71.1<br />
Churu 0.7 99.3 46.2 53.8<br />
Dausa 2.8 97.2 40.0 60.0<br />
Dholpur 2.1 97.9 38.6 61.4<br />
Jhalawar 100.0 43.8 56.2<br />
Rajsamand 100.0 24.0 76.0<br />
Tonk 3.3 96.7 50.3 49.7<br />
Total 1.5 98.5 38.1 61.9<br />
There are four types <strong>of</strong> sub-projects viz., livestock, land-based activity, community<br />
infrastructure and non-farm services. The household responses are recorded in table 3.12.<br />
It was enquired as to whe<strong>the</strong>r <strong>the</strong> household had participated in any <strong>of</strong> <strong>the</strong> meetings organized<br />
to select <strong>the</strong> SPA- <strong>the</strong> response reveals that <strong>of</strong> <strong>the</strong> APL households, <strong>the</strong> proportion <strong>of</strong><br />
households participating in meetings varies from a low <strong>of</strong> 50.0 percent in Baran and a high <strong>of</strong><br />
100.0 percent in Churu, Dholpur and Tonk. In Rajasamand and Jhalawar none <strong>of</strong> <strong>the</strong><br />
households participated in any <strong>of</strong> <strong>the</strong> meetings (table 3.13). In case <strong>of</strong> BPL households, <strong>the</strong><br />
proportion <strong>of</strong> households range from a low <strong>of</strong> 63.9 percent in Baran and a high <strong>of</strong> 95.1<br />
percent in Dholpur.<br />
Have <strong>the</strong>y received training from DPIP It is found that a significant percentage reported in<br />
affirmative in both APL and BPL households, though inter-district variations are <strong>the</strong>re. Are<br />
<strong>the</strong>y still active members <strong>of</strong> CIG It appears that a higher percentage <strong>of</strong> APL households have<br />
members who are active members <strong>of</strong> CIGs compared to BPL households.<br />
Table 2.32: Type <strong>of</strong> Sub-projects (SPA)<br />
Livestock Land-based Community On-farm NoR<br />
Activity infrastructure services<br />
APL Baran 50.0 50.0<br />
Churu 100.0<br />
Dausa 33.3 33.3 33.3<br />
Dholpur 100.0<br />
Tonk 75.0 25.0<br />
Total 64.3 14.3 7.1 7.1 7.1<br />
BPL Baran 59.7 23.6 16.7<br />
Churu 89.4 2.9 3.8 2.9 1.0<br />
Dausa 84.7 6.3 9.0<br />
Dholpur 96.7 0.8 0.8 1.6<br />
Jhalawar 73.0 4.5 6.7 15.7<br />
Rajsamand 61.3 27.4 4.8 6.5<br />
Tonk 67.0 22.7 8.2 2.1<br />
Total 78.6 10.8 4.9 5.6 0.2<br />
70