Impact Assessment of the District Poverty Initiative Project Rajasthan
Impact Assessment of the District Poverty Initiative Project Rajasthan
Impact Assessment of the District Poverty Initiative Project Rajasthan

You also want an ePaper? Increase the reach of your titles
YUMPU automatically turns print PDFs into web optimized ePapers that Google loves.
Baran Mean 4398 4451 5935 35<br />
N 9 2 2<br />
Churu Mean 8119 1522 -100 -100<br />
N 1 1<br />
Dausa Mean 5007 10903 4080 6051 -19 -45<br />
N 6 7 2 9<br />
Dholpur Mean 1015 22328 4080 -100 -82<br />
N 1 2 2<br />
Jhalawar Mean 4757 5968 4637 7419 -3 24<br />
N 8 3 4 2<br />
Rajsamand Mean 11773 12106 20773 -100 72<br />
N 5 10 2<br />
Tonk Mean 5409 5468 3710 11129 -31 104<br />
N 8 8 2 1<br />
Total Mean 6185 8619 4303 7889 -30 -8<br />
N 29 40 10 18<br />
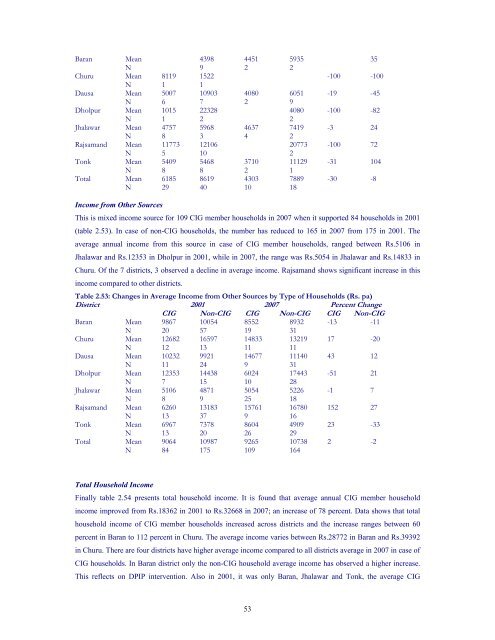
Income from O<strong>the</strong>r Sources<br />
This is mixed income source for 109 CIG member households in 2007 when it supported 84 households in 2001<br />
(table 2.53). In case <strong>of</strong> non-CIG households, <strong>the</strong> number has reduced to 165 in 2007 from 175 in 2001. The<br />
average annual income from this source in case <strong>of</strong> CIG member households, ranged between Rs.5106 in<br />
Jhalawar and Rs.12353 in Dholpur in 2001, while in 2007, <strong>the</strong> range was Rs.5054 in Jhalawar and Rs.14833 in<br />
Churu. Of <strong>the</strong> 7 districts, 3 observed a decline in average income. Rajsamand shows significant increase in this<br />
income compared to o<strong>the</strong>r districts.<br />
Table 2.53: Changes in Average Income from O<strong>the</strong>r Sources by Type <strong>of</strong> Households (Rs. pa)<br />
<strong>District</strong> 2001 2007 Percent Change<br />
CIG Non-CIG CIG Non-CIG CIG Non-CIG<br />
Baran Mean 9867 10054 8552 8932 -13 -11<br />
N 20 57 19 31<br />
Churu Mean 12682 16597 14833 13219 17 -20<br />
N 12 13 11 11<br />
Dausa Mean 10232 9921 14677 11140 43 12<br />
N 11 24 9 31<br />
Dholpur Mean 12353 14438 6024 17443 -51 21<br />
N 7 15 10 28<br />
Jhalawar Mean 5106 4871 5054 5226 -1 7<br />
N 8 9 25 18<br />
Rajsamand Mean 6260 13183 15761 16780 152 27<br />
N 13 37 9 16<br />
Tonk Mean 6967 7378 8604 4909 23 -33<br />
N 13 20 26 29<br />
Total Mean 9064 10987 9265 10738 2 -2<br />
N 84 175 109 164<br />
Total Household Income<br />
Finally table 2.54 presents total household income. It is found that average annual CIG member household<br />
income improved from Rs.18362 in 2001 to Rs.32668 in 2007; an increase <strong>of</strong> 78 percent. Data shows that total<br />
household income <strong>of</strong> CIG member households increased across districts and <strong>the</strong> increase ranges between 60<br />
percent in Baran to 112 percent in Churu. The average income varies between Rs.28772 in Baran and Rs.39392<br />
in Churu. There are four districts have higher average income compared to all districts average in 2007 in case <strong>of</strong><br />
CIG households. In Baran district only <strong>the</strong> non-CIG household average income has observed a higher increase.<br />
This reflects on DPIP intervention. Also in 2001, it was only Baran, Jhalawar and Tonk, <strong>the</strong> average CIG<br />
53