Impact Assessment of the District Poverty Initiative Project Rajasthan
Impact Assessment of the District Poverty Initiative Project Rajasthan
Impact Assessment of the District Poverty Initiative Project Rajasthan

Create successful ePaper yourself
Turn your PDF publications into a flip-book with our unique Google optimized e-Paper software.
Dholpur Mean 1 1 2 1 45 -6<br />
N 74 107 75 79<br />
Jhalawar Mean 1 1 2 2 59 43<br />
N 11 11 50 18<br />
Rajsamand Mean 1 1 1 1 2 19<br />
N 21 55 19 67<br />
Tonk Mean 1 2 2 1 32 -12<br />
N 37 34 43 38<br />
Total Mean 1 1 2 1 20 0<br />
Sum 285 437 484 410 70 -6<br />
N 220 331 312 311<br />
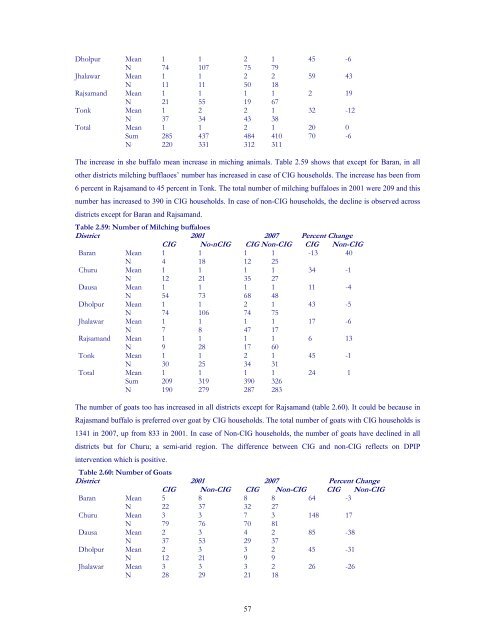
The increase in she buffalo mean increase in miching animals. Table 2.59 shows that except for Baran, in all<br />
o<strong>the</strong>r districts milching bufflaoes’ number has increased in case <strong>of</strong> CIG households. The increase has been from<br />
6 percent in Rajsamand to 45 percent in Tonk. The total number <strong>of</strong> milching buffaloes in 2001 were 209 and this<br />
number has increased to 390 in CIG households. In case <strong>of</strong> non-CIG households, <strong>the</strong> decline is observed across<br />
districts except for Baran and Rajsamand.<br />
Table 2.59: Number <strong>of</strong> Milching buffaloes<br />
<strong>District</strong> 2001 2007 Percent Change<br />
CIG No-nCIG CIG Non-CIG CIG Non-CIG<br />
Baran Mean 1 1 1 1 -13 40<br />
N 4 18 12 25<br />
Churu Mean 1 1 1 1 34 -1<br />
N 12 21 35 27<br />
Dausa Mean 1 1 1 1 11 -4<br />
N 54 73 68 48<br />
Dholpur Mean 1 1 2 1 43 -5<br />
N 74 106 74 75<br />
Jhalawar Mean 1 1 1 1 17 -6<br />
N 7 8 47 17<br />
Rajsamand Mean 1 1 1 1 6 13<br />
N 9 28 17 60<br />
Tonk Mean 1 1 2 1 45 -1<br />
N 30 25 34 31<br />
Total Mean 1 1 1 1 24 1<br />
Sum 209 319 390 326<br />
N 190 279 287 283<br />
The number <strong>of</strong> goats too has increased in all districts except for Rajsamand (table 2.60). It could be because in<br />
Rajasmand buffalo is preferred over goat by CIG households. The total number <strong>of</strong> goats with CIG households is<br />
1341 in 2007, up from 833 in 2001. In case <strong>of</strong> Non-CIG households, <strong>the</strong> number <strong>of</strong> goats have declined in all<br />
districts but for Churu; a semi-arid region. The difference between CIG and non-CIG reflects on DPIP<br />
intervention which is positive.<br />
Table 2.60: Number <strong>of</strong> Goats<br />
<strong>District</strong> 2001 2007 Percent Change<br />
CIG Non-CIG CIG Non-CIG CIG Non-CIG<br />
Baran Mean 5 8 8 8 64 -3<br />
N 22 37 32 27<br />
Churu Mean 3 3 7 3 148 17<br />
N 79 76 70 81<br />
Dausa Mean 2 3 4 2 85 -38<br />
N 37 53 29 37<br />
Dholpur Mean 2 3 3 2 45 -31<br />
N 12 21 9 9<br />
Jhalawar Mean 3 3 3 2 26 -26<br />
N 28 29 21 18<br />
57