- Page 2 and 3:
Spatial Modelling of the Terrestria
- Page 4 and 5:
Copyright C○ 2004 John Wiley & So
- Page 6 and 7:
Contents List of Contributors Prefa
- Page 8 and 9:
Contributors Jonathan L. Bamber Sch
- Page 10 and 11:
List of Contributors xi George Perr
- Page 12 and 13:
xiv Preface in theory and applicati
- Page 14 and 15:
2 Spatial Modelling of the Terrestr
- Page 16 and 17:
4 Spatial Modelling of the Terrestr
- Page 18 and 19:
6 Spatial Modelling of the Terrestr
- Page 20 and 21:
Editorial: Spatial Modelling in Hyd
- Page 22 and 23:
Editorial: Spatial Modelling in Hyd
- Page 24 and 25:
2 Modelling Ice Sheet Dynamics with
- Page 26 and 27:
Modelling Ice Sheet Dynamics by Sat
- Page 28 and 29:
Modelling Ice Sheet Dynamics by Sat
- Page 30 and 31:
Modelling Ice Sheet Dynamics by Sat
- Page 32 and 33:
Modelling Ice Sheet Dynamics by Sat
- Page 34 and 35:
Modelling Ice Sheet Dynamics by Sat
- Page 36 and 37:
Modelling Ice Sheet Dynamics by Sat
- Page 38 and 39:
Modelling Ice Sheet Dynamics by Sat
- Page 40 and 41:
Modelling Ice Sheet Dynamics by Sat
- Page 42 and 43:
Modelling Ice Sheet Dynamics by Sat
- Page 44 and 45:
Modelling Ice Sheet Dynamics by Sat
- Page 46 and 47:
36 Spatial Modelling of the Terrest
- Page 48 and 49:
38 Spatial Modelling of the Terrest
- Page 50 and 51:
40 Spatial Modelling of the Terrest
- Page 52 and 53:
42 Spatial Modelling of the Terrest
- Page 54 and 55:
44 Spatial Modelling of the Terrest
- Page 56 and 57:
46 Spatial Modelling of the Terrest
- Page 58 and 59:
48 Spatial Modelling of the Terrest
- Page 60 and 61:
50 Spatial Modelling of the Terrest
- Page 62 and 63:
52 Spatial Modelling of the Terrest
- Page 64 and 65:
54 Spatial Modelling of the Terrest
- Page 66 and 67:
56 Spatial Modelling of the Terrest
- Page 68 and 69:
4 Using Coupled Land Surface and Mi
- Page 70 and 71:
Coupled Land Surface and Microwave
- Page 72 and 73:
Coupled Land Surface and Microwave
- Page 74 and 75:
Coupled Land Surface and Microwave
- Page 76 and 77:
Coupled Land Surface and Microwave
- Page 78 and 79:
Coupled Land Surface and Microwave
- Page 80 and 81:
Coupled Land Surface and Microwave
- Page 82 and 83:
Coupled Land Surface and Microwave
- Page 84 and 85:
Coupled Land Surface and Microwave
- Page 86 and 87:
Coupled Land Surface and Microwave
- Page 88 and 89:
80 Spatial Modelling of the Terrest
- Page 90 and 91:
82 Spatial Modelling of the Terrest
- Page 92 and 93:
84 Spatial Modelling of the Terrest
- Page 94 and 95:
86 Spatial Modelling of the Terrest
- Page 96 and 97:
88 Spatial Modelling of the Terrest
- Page 98 and 99:
90 Spatial Modelling of the Terrest
- Page 100 and 101:
92 Spatial Modelling of the Terrest
- Page 102 and 103:
94 Spatial Modelling of the Terrest
- Page 104 and 105:
96 Spatial Modelling of the Terrest
- Page 106 and 107:
98 Spatial Modelling of the Terrest
- Page 108 and 109:
100 Spatial Modelling of the Terres
- Page 110 and 111:
102 Spatial Modelling of the Terres
- Page 112 and 113:
104 Spatial Modelling of the Terres
- Page 114 and 115:
106 Spatial Modelling of the Terres
- Page 116 and 117:
Editorial: Terrestrial Sediment and
- Page 118 and 119:
Editorial: Terrestrial Sediment and
- Page 120 and 121:
6 Remotely Sensed Topographic Data
- Page 122 and 123:
Remotely Sensed Topographic Data fo
- Page 124 and 125:
Remotely Sensed Topographic Data fo
- Page 126 and 127:
Remotely Sensed Topographic Data fo
- Page 128 and 129:
Remotely Sensed Topographic Data fo
- Page 130 and 131:
Remotely Sensed Topographic Data fo
- Page 132 and 133:
Remotely Sensed Topographic Data fo
- Page 134 and 135:
Remotely Sensed Topographic Data fo
- Page 136 and 137:
Remotely Sensed Topographic Data fo
- Page 138 and 139:
Remotely Sensed Topographic Data fo
- Page 140 and 141:
Remotely Sensed Topographic Data fo
- Page 142 and 143:
Remotely Sensed Topographic Data fo
- Page 144 and 145:
7 Modelling Wind Erosion and Dust E
- Page 146 and 147:
Modelling Wind Erosion and Dust Emi
- Page 148 and 149:
Modelling Wind Erosion and Dust Emi
- Page 150 and 151:
Modelling Wind Erosion and Dust Emi
- Page 152 and 153:
Modelling Wind Erosion and Dust Emi
- Page 154 and 155:
Modelling Wind Erosion and Dust Emi
- Page 156 and 157:
Modelling Wind Erosion and Dust Emi
- Page 158 and 159:
Modelling Wind Erosion and Dust Emi
- Page 160 and 161:
Modelling Wind Erosion and Dust Emi
- Page 162 and 163:
Modelling Wind Erosion and Dust Emi
- Page 164 and 165:
8 Near Real-Time Modelling of Regio
- Page 166 and 167: Near Real-Time Modelling of Regiona
- Page 168 and 169: Near Real-Time Modelling of Regiona
- Page 170 and 171: Near Real-Time Modelling of Regiona
- Page 172 and 173: Near Real-Time Modelling of Regiona
- Page 174 and 175: Near Real-Time Modelling of Regiona
- Page 176 and 177: High Low TSM Concentration Figure 8
- Page 178 and 179: Near Real-Time Modelling of Regiona
- Page 180 and 181: Near Real-Time Modelling of Regiona
- Page 182 and 183: 9 Estimation of Energy Emissions, F
- Page 184 and 185: Fireline Intensity and Biomass Cons
- Page 186 and 187: Fireline Intensity and Biomass Cons
- Page 188 and 189: Fireline Intensity and Biomass Cons
- Page 190 and 191: Fireline Intensity and Biomass Cons
- Page 192 and 193: Fireline Intensity and Biomass Cons
- Page 194 and 195: Figure 9.4 The upper row shows EOS
- Page 196 and 197: Fireline Intensity and Biomass Cons
- Page 198 and 199: Fireline Intensity and Biomass Cons
- Page 200 and 201: Fireline Intensity and Biomass Cons
- Page 202 and 203: Fireline Intensity and Biomass Cons
- Page 204 and 205: PART III SPATIAL MODELLING OF URBAN
- Page 206 and 207: 200 Spatial Modelling of the Terres
- Page 208 and 209: 202 Spatial Modelling of the Terres
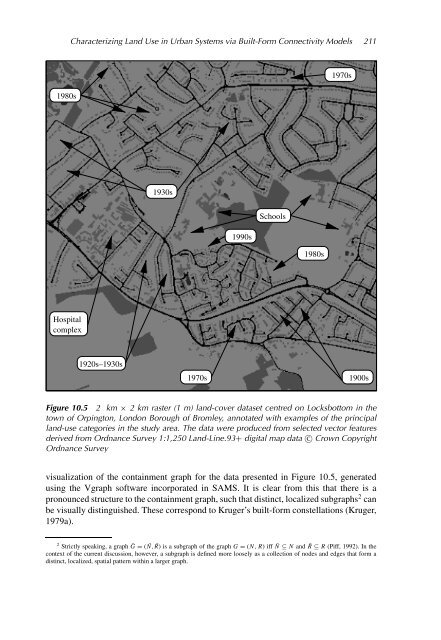
- Page 210 and 211: 204 Spatial Modelling of the Terres
- Page 212 and 213: 206 Spatial Modelling of the Terres
- Page 214 and 215: 208 Spatial Modelling of the Terres
- Page 218 and 219: 212 Spatial Modelling of the Terres
- Page 220 and 221: 214 Spatial Modelling of the Terres
- Page 222 and 223: 216 Spatial Modelling of the Terres
- Page 224 and 225: 218 Spatial Modelling of the Terres
- Page 226 and 227: 220 Spatial Modelling of the Terres
- Page 228 and 229: 222 Spatial Modelling of the Terres
- Page 230 and 231: 224 Spatial Modelling of the Terres
- Page 232 and 233: 11 Modelling the Impact of Traffic
- Page 234 and 235: Modelling the Impact of Traffic Emi
- Page 236 and 237: Modelling the Impact of Traffic Emi
- Page 238 and 239: Modelling the Impact of Traffic Emi
- Page 240 and 241: Modelling the Impact of Traffic Emi
- Page 242 and 243: Modelling the Impact of Traffic Emi
- Page 244 and 245: Modelling the Impact of Traffic Emi
- Page 246 and 247: Modelling the Impact of Traffic Emi
- Page 248 and 249: PART IV CURRENT CHALLENGES AND FUTU
- Page 250 and 251: 246 Spatial Modelling of the Terres
- Page 252 and 253: 248 Spatial Modelling of the Terres
- Page 254 and 255: 250 Spatial Modelling of the Terres
- Page 256 and 257: 252 Spatial Modelling of the Terres
- Page 258 and 259: 254 Spatial Modelling of the Terres
- Page 260 and 261: 256 Spatial Modelling of the Terres
- Page 262 and 263: 258 Spatial Modelling of the Terres
- Page 264 and 265: 260 Spatial Modelling of the Terres
- Page 266 and 267:
262 Spatial Modelling of the Terres
- Page 268 and 269:
264 Spatial Modelling of the Terres
- Page 270 and 271:
266 Spatial Modelling of the Terres
- Page 272 and 273:
268 Index Bi-spectral InfraRed Dete
- Page 274 and 275:
270 Index floodplain maps, UK 92 fl
- Page 276 and 277:
272 Index Long-Term Ecological Rese
- Page 278 and 279:
274 Index snow depth measurement ne
- Page 280:
276 Index urban land use in remotel