MART Vol. II MO/MP - NESA - Civil Air Patrol
MART Vol. II MO/MP - NESA - Civil Air Patrol
MART Vol. II MO/MP - NESA - Civil Air Patrol
You also want an ePaper? Increase the reach of your titles
YUMPU automatically turns print PDFs into web optimized ePapers that Google loves.
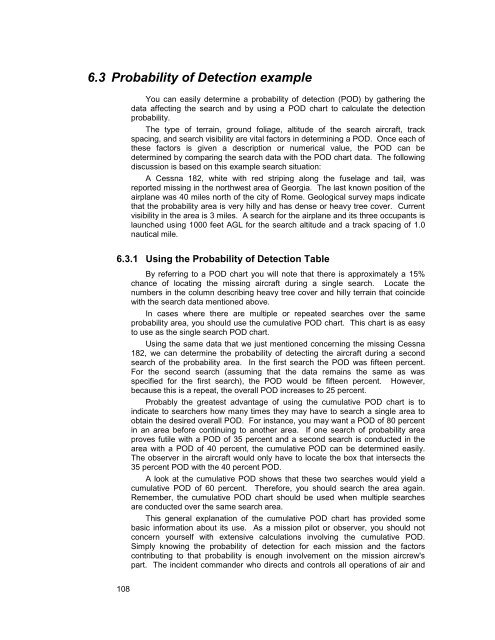
6.3 Probability of Detection exampleYou can easily determine a probability of detection (POD) by gathering thedata affecting the search and by using a POD chart to calculate the detectionprobability.The type of terrain, ground foliage, altitude of the search aircraft, trackspacing, and search visibility are vital factors in determining a POD. Once each ofthese factors is given a description or numerical value, the POD can bedetermined by comparing the search data with the POD chart data. The followingdiscussion is based on this example search situation:A Cessna 182, white with red striping along the fuselage and tail, wasreported missing in the northwest area of Georgia. The last known position of theairplane was 40 miles north of the city of Rome. Geological survey maps indicatethat the probability area is very hilly and has dense or heavy tree cover. Currentvisibility in the area is 3 miles. A search for the airplane and its three occupants islaunched using 1000 feet AGL for the search altitude and a track spacing of 1.0nautical mile.6.3.1 Using the Probability of Detection TableBy referring to a POD chart you will note that there is approximately a 15%chance of locating the missing aircraft during a single search. Locate thenumbers in the column describing heavy tree cover and hilly terrain that coincidewith the search data mentioned above.In cases where there are multiple or repeated searches over the sameprobability area, you should use the cumulative POD chart. This chart is as easyto use as the single search POD chart.Using the same data that we just mentioned concerning the missing Cessna182, we can determine the probability of detecting the aircraft during a secondsearch of the probability area. In the first search the POD was fifteen percent.For the second search (assuming that the data remains the same as wasspecified for the first search), the POD would be fifteen percent. However,because this is a repeat, the overall POD increases to 25 percent.Probably the greatest advantage of using the cumulative POD chart is toindicate to searchers how many times they may have to search a single area toobtain the desired overall POD. For instance, you may want a POD of 80 percentin an area before continuing to another area. If one search of probability areaproves futile with a POD of 35 percent and a second search is conducted in thearea with a POD of 40 percent, the cumulative POD can be determined easily.The observer in the aircraft would only have to locate the box that intersects the35 percent POD with the 40 percent POD.A look at the cumulative POD shows that these two searches would yield acumulative POD of 60 percent. Therefore, you should search the area again.Remember, the cumulative POD chart should be used when multiple searchesare conducted over the same search area.This general explanation of the cumulative POD chart has provided somebasic information about its use. As a mission pilot or observer, you should notconcern yourself with extensive calculations involving the cumulative POD.Simply knowing the probability of detection for each mission and the factorscontributing to that probability is enough involvement on the mission aircrew'spart. The incident commander who directs and controls all operations of air and108


