01 - Department of Education and Communities - NSW Government
01 - Department of Education and Communities - NSW Government
01 - Department of Education and Communities - NSW Government

You also want an ePaper? Increase the reach of your titles
YUMPU automatically turns print PDFs into web optimized ePapers that Google loves.
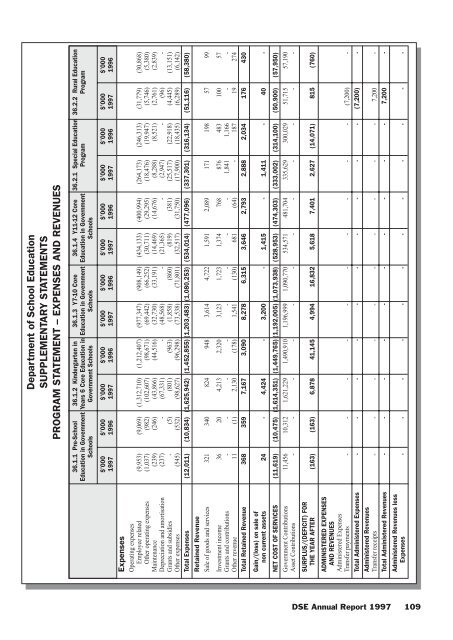
<strong>Department</strong> <strong>of</strong> School <strong>Education</strong>SUPPLEMENTARY STATEMENTSPROGRAM STATEMENT – EXPENSES AND REVENUES36.1.1 Pre-School<strong>Education</strong> in <strong>Government</strong>Schools36.1.2 Kindergarten inYears 6 Core <strong>Education</strong> in<strong>Government</strong> Schools36.1.3 Y7-10 Core<strong>Education</strong> in <strong>Government</strong>Schools36.1.4 Y11-12 Core<strong>Education</strong> in <strong>Government</strong>Schools36.2.1 Special <strong>Education</strong>Program36.2.2 Rural <strong>Education</strong>Program$’000 $’000 $’000 $’000 $’000 $’000 $’000 $’000 $’000 $’000 $’000 $’00<strong>01</strong>997 1996 1997 1996 1997 1996 1997 1996 1997 1996 1997 1996ExpensesOperating expensesEmployee related (9,953) (9,069) (1,312,710) (1,212,407) (977,347) (908,149) (434,133) (400,994) (264,173) (246,313) (31,779) (30,868)Other operating expenses (1,037) (982) (102,607) (98,671) (69,442) (66,252) (30,711) (29,295) (18,476) (19,947) (5,746) (5,380)Maintenance (239) (246) (43,866) (44,516) (32,730) (33,191) (14,469) (14,676) (8,288) (8,521) (2,761) (2,839)Depreciation <strong>and</strong> amortisation (237) - (67,331) - (48,568) - (21,365) - (2,947) - (96) -Grants <strong>and</strong> subsidies - (5) (8<strong>01</strong>) (963) (1,858) (860) (819) (381) (25,517) (22,918) (4,445) (13,151)Other expenses (545) (532) (98,627) (96,298) (73,538) (71,8<strong>01</strong>) (32,517) (31,750) (17,900) (18,435) (6,289) (6,142)Total Expenses (12,<strong>01</strong>1) (10,834) (1,625,942) (1,452,855) (1,203,483) (1,080,253) (534,<strong>01</strong>4) (477,096) (337,3<strong>01</strong>) (316,134) (51,116) (58,380)Retained RevenueSale <strong>of</strong> goods <strong>and</strong> services 321 340 824 948 3,614 4,722 1,591 2,089 171 198 57 99Investment income 36 20 4,213 2,320 3,123 1,723 1,374 768 876 483 100 57Grants <strong>and</strong> contributions - - - - - - - - 1,841 1,166 - -Other revenue 11 (1) 2,130 (178) 1,541 (130) 681 (64) - 187 19 274Total Retained Revenue 368 359 7,167 3,090 8,278 6,315 3,646 2,793 2,888 2,034 176 430Gain/(loss) on sale <strong>of</strong>non current assets 24 - 4,424 - 3,200 - 1,415 - 1,411 - 40 -NET COST OF SERVICES (11,619) (10,475) (1,614,351) (1,449,765) (1,192,005) (1,073,938) (528,953) (474,303) (333,002) (314,100) (50,900) (57,950)<strong>Government</strong> Contributions 11,456 10,312 1,621,229 1,490,910 1,196,999 1,090,770 534,571 481,704 335,629 300,029 51,715 57,190Asset Contributions - - - - - - - - - - - -SURPLUS/(DEFICIT) FORTHE YEAR AFTER (163) (163) 6,878 41,145 4,994 16,832 5,618 7,4<strong>01</strong> 2,627 (14,071) 815 (760)ADMINISTERED EXPENSESAND REVENUESAdministered ExpensesTransfer payments - - - - - - - - - - (7,200) -Total Administered Expenses - - - - - - - - - - (7,200) -Administered RevenuesTransfer receipts - - - - - - - - - - 7,200 -Total Administered Revenues - - - - - - - - - - 7,200 -Administered Revenues lessExpenses - - - - - - - - - - - -DSE Annual Report 1997 109