01 - Department of Education and Communities - NSW Government
01 - Department of Education and Communities - NSW Government
01 - Department of Education and Communities - NSW Government

Create successful ePaper yourself
Turn your PDF publications into a flip-book with our unique Google optimized e-Paper software.
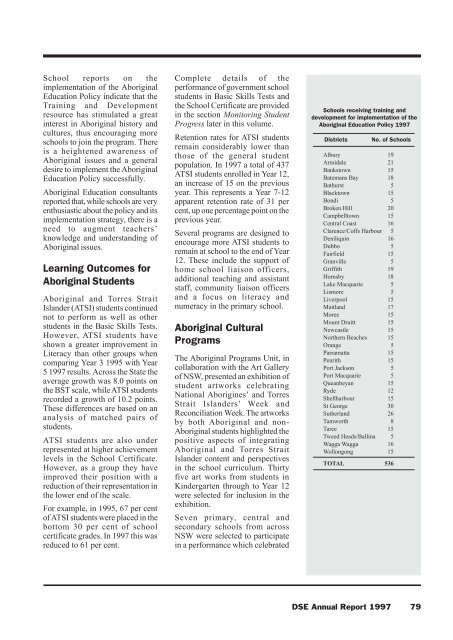
School reports on theimplementation <strong>of</strong> the Aboriginal<strong>Education</strong> Policy indicate that theTraining <strong>and</strong> Developmentresource has stimulated a greatinterest in Aboriginal history <strong>and</strong>cultures, thus encouraging moreschools to join the program. Thereis a heightened awareness <strong>of</strong>Aboriginal issues <strong>and</strong> a generaldesire to implement the Aboriginal<strong>Education</strong> Policy successfully.Aboriginal <strong>Education</strong> consultantsreported that, while schools are veryenthusiastic about the policy <strong>and</strong> itsimplementation strategy, there is aneed to augment teachers’knowledge <strong>and</strong> underst<strong>and</strong>ing <strong>of</strong>Aboriginal issues.Learning Outcomes forAboriginal StudentsAboriginal <strong>and</strong> Torres StraitIsl<strong>and</strong>er (ATSI) students continuednot to perform as well as otherstudents in the Basic Skills Tests.However, ATSI students haveshown a greater improvement inLiteracy than other groups whencomparing Year 3 1995 with Year5 1997 results. Across the State theaverage growth was 8.0 points onthe BST scale, while ATSI studentsrecorded a growth <strong>of</strong> 10.2 points.These differences are based on ananalysis <strong>of</strong> matched pairs <strong>of</strong>students.ATSI students are also underrepresented at higher achievementlevels in the School Certificate.However, as a group they haveimproved their position with areduction <strong>of</strong> their representation inthe lower end <strong>of</strong> the scale.For example, in 1995, 67 per cent<strong>of</strong> ATSI students were placed in thebottom 30 per cent <strong>of</strong> schoolcertificate grades. In 1997 this wasreduced to 61 per cent.Complete details <strong>of</strong> theperformance <strong>of</strong> government schoolstudents in Basic Skills Tests <strong>and</strong>the School Certificate are providedin the section Monitoring StudentProgress later in this volume.Retention rates for ATSI studentsremain considerably lower thanthose <strong>of</strong> the general studentpopulation. In 1997 a total <strong>of</strong> 437ATSI students enrolled in Year 12,an increase <strong>of</strong> 15 on the previousyear. This represents a Year 7-12apparent retention rate <strong>of</strong> 31 percent, up one percentage point on theprevious year.Several programs are designed toencourage more ATSI students toremain at school to the end <strong>of</strong> Year12. These include the support <strong>of</strong>home school liaison <strong>of</strong>ficers,additional teaching <strong>and</strong> assistantstaff, community liaison <strong>of</strong>ficers<strong>and</strong> a focus on literacy <strong>and</strong>numeracy in the primary school.Aboriginal CulturalProgramsThe Aboriginal Programs Unit, incollaboration with the Art Gallery<strong>of</strong> <strong>NSW</strong>, presented an exhibition <strong>of</strong>student artworks celebratingNational Aborigines’ <strong>and</strong> TorresStrait Isl<strong>and</strong>ers’ Week <strong>and</strong>Reconciliation Week. The artworksby both Aboriginal <strong>and</strong> non-Aboriginal students highlighted thepositive aspects <strong>of</strong> integratingAboriginal <strong>and</strong> Torres StraitIsl<strong>and</strong>er content <strong>and</strong> perspectivesin the school curriculum. Thirtyfive art works from students inKindergarten through to Year 12were selected for inclusion in theexhibition.Seven primary, central <strong>and</strong>secondary schools from across<strong>NSW</strong> were selected to participatein a performance which celebratedSchools receiving training <strong>and</strong>development for implementation <strong>of</strong> theAboriginal <strong>Education</strong> Policy 1997DistrictsNo. <strong>of</strong> SchoolsAlbury 19Armidale 21Bankstown 15Batemans Bay 18Bathurst 5Blacktown 15Bondi 5Broken Hill 20Campbelltown 15Central Coast 16Clarence/C<strong>of</strong>fs Harbour 5Deniliquin 16Dubbo 5Fairfield 15Granville 5Griffith 19Hornsby 18Lake Macquarie 5Lismore 5Liverpool 15Maitl<strong>and</strong> 17Moree 15Mount Druitt 15Newcastle 15Northern Beaches 15Orange 5Parramatta 15Penrith 15Port Jackson 5Port Macquarie 5Queanbeyan 15Ryde 12Shellharbour 15St George 30Sutherl<strong>and</strong> 26Tamworth 8Taree 15Tweed Heads/Ballina 5Wagga Wagga 16Wollongong 15TOTAL 536DSE Annual Report 1997 79