01 - Department of Education and Communities - NSW Government
01 - Department of Education and Communities - NSW Government
01 - Department of Education and Communities - NSW Government

You also want an ePaper? Increase the reach of your titles
YUMPU automatically turns print PDFs into web optimized ePapers that Google loves.
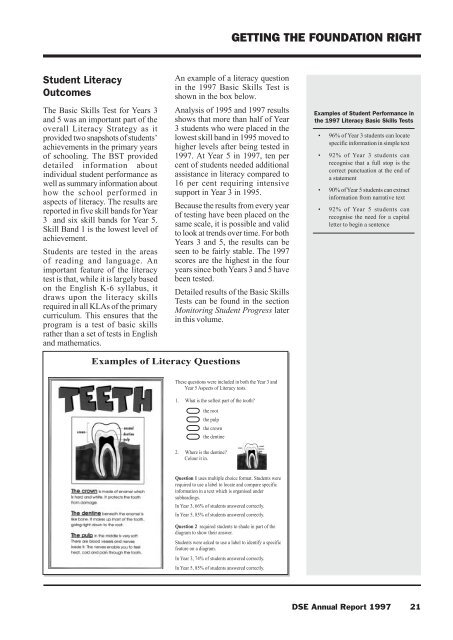
GETTING THE FOUNDATION RIGHTStudent LiteracyOutcomesThe Basic Skills Test for Years 3<strong>and</strong> 5 was an important part <strong>of</strong> theoverall Literacy Strategy as itprovided two snapshots <strong>of</strong> students’achievements in the primary years<strong>of</strong> schooling. The BST provideddetailed information aboutindividual student performance aswell as summary information abouthow the school performed inaspects <strong>of</strong> literacy. The results arereported in five skill b<strong>and</strong>s for Year3 <strong>and</strong> six skill b<strong>and</strong>s for Year 5.Skill B<strong>and</strong> 1 is the lowest level <strong>of</strong>achievement.Students are tested in the areas<strong>of</strong> reading <strong>and</strong> language. Animportant feature <strong>of</strong> the literacytest is that, while it is largely basedon the English K-6 syllabus, itdraws upon the literacy skillsrequired in all KLAs <strong>of</strong> the primarycurriculum. This ensures that theprogram is a test <strong>of</strong> basic skillsrather than a set <strong>of</strong> tests in English<strong>and</strong> mathematics.An example <strong>of</strong> a literacy questionin the 1997 Basic Skills Test isshown in the box below.Analysis <strong>of</strong> 1995 <strong>and</strong> 1997 resultsshows that more than half <strong>of</strong> Year3 students who were placed in thelowest skill b<strong>and</strong> in 1995 moved tohigher levels after being tested in1997. At Year 5 in 1997, ten percent <strong>of</strong> students needed additionalassistance in literacy compared to16 per cent requiring intensivesupport in Year 3 in 1995.Because the results from every year<strong>of</strong> testing have been placed on thesame scale, it is possible <strong>and</strong> validto look at trends over time. For bothYears 3 <strong>and</strong> 5, the results can beseen to be fairly stable. The 1997scores are the highest in the fouryears since both Years 3 <strong>and</strong> 5 havebeen tested.Detailed results <strong>of</strong> the Basic SkillsTests can be found in the sectionMonitoring Student Progress laterin this volume.Examples <strong>of</strong> Student Performance inthe 1997 Literacy Basic Skills Tests• 96% <strong>of</strong> Year 3 students can locatespecific information in simple text• 92% <strong>of</strong> Year 3 students canrecognise that a full stop is thecorrect punctuation at the end <strong>of</strong>a statement• 90% <strong>of</strong> Year 5 students can extractinformation from narrative text• 92% <strong>of</strong> Year 5 students canrecognise the need for a capitalletter to begin a sentenceExamples <strong>of</strong> Literacy QuestionsThese questions were included in both the Year 3 <strong>and</strong>Year 5 Aspects <strong>of</strong> Literacy tests.1. What is the s<strong>of</strong>test part <strong>of</strong> the tooth?the rootthe pulpthe crownthe dentine2. Where is the dentine?Colour it in.Question 1 uses multiple choice format. Students wererequired to use a label to locate <strong>and</strong> compare specificinformation in a text which is organised undersubheadings.In Year 3, 66% <strong>of</strong> students answered correctly.In Year 5, 85% <strong>of</strong> students answered correctly.Question 2 required students to shade in part <strong>of</strong> thediagram to show their answer.Students were asked to use a label to identify a specificfeature on a diagram.In Year 3, 74% <strong>of</strong> students answered correctly.In Year 5, 85% <strong>of</strong> students answered correctly.DSE Annual Report 1997 21