01 - Department of Education and Communities - NSW Government
01 - Department of Education and Communities - NSW Government
01 - Department of Education and Communities - NSW Government

Create successful ePaper yourself
Turn your PDF publications into a flip-book with our unique Google optimized e-Paper software.
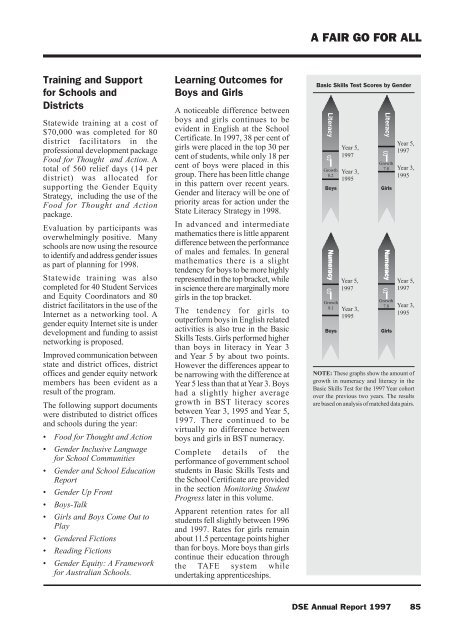
A FAIR GO FOR ALLTraining <strong>and</strong> Supportfor Schools <strong>and</strong>DistrictsStatewide training at a cost <strong>of</strong>$70,000 was completed for 80district facilitators in thepr<strong>of</strong>essional development packageFood for Thought <strong>and</strong> Action. Atotal <strong>of</strong> 560 relief days (14 perdistrict) was allocated forsupporting the Gender EquityStrategy, including the use <strong>of</strong> theFood for Thought <strong>and</strong> Actionpackage.Evaluation by participants wasoverwhelmingly positive. Manyschools are now using the resourceto identify <strong>and</strong> address gender issuesas part <strong>of</strong> planning for 1998.Statewide training was alsocompleted for 40 Student Services<strong>and</strong> Equity Coordinators <strong>and</strong> 80district facilitators in the use <strong>of</strong> theInternet as a networking tool. Agender equity Internet site is underdevelopment <strong>and</strong> funding to assistnetworking is proposed.Improved communication betweenstate <strong>and</strong> district <strong>of</strong>fices, district<strong>of</strong>fices <strong>and</strong> gender equity networkmembers has been evident as aresult <strong>of</strong> the program.The following support documentswere distributed to district <strong>of</strong>fices<strong>and</strong> schools during the year:• Food for Thought <strong>and</strong> Action• Gender Inclusive Languagefor School <strong>Communities</strong>• Gender <strong>and</strong> School <strong>Education</strong>Report• Gender Up Front• Boys-Talk• Girls <strong>and</strong> Boys Come Out toPlay• Gendered Fictions• Reading Fictions• Gender Equity: A Frameworkfor Australian Schools.Learning Outcomes forBoys <strong>and</strong> GirlsA noticeable difference betweenboys <strong>and</strong> girls continues to beevident in English at the SchoolCertificate. In 1997, 38 per cent <strong>of</strong>girls were placed in the top 30 percent <strong>of</strong> students, while only 18 percent <strong>of</strong> boys were placed in thisgroup. There has been little changein this pattern over recent years.Gender <strong>and</strong> literacy will be one <strong>of</strong>priority areas for action under theState Literacy Strategy in 1998.In advanced <strong>and</strong> intermediatemathematics there is little apparentdifference between the performance<strong>of</strong> males <strong>and</strong> females. In generalmathematics there is a slighttendency for boys to be more highlyrepresented in the top bracket, whilein science there are marginally moregirls in the top bracket.The tendency for girls tooutperform boys in English relatedactivities is also true in the BasicSkills Tests. Girls performed higherthan boys in literacy in Year 3<strong>and</strong> Year 5 by about two points.However the differences appear tobe narrowing with the difference atYear 5 less than that at Year 3. Boyshad a slightly higher averagegrowth in BST literacy scoresbetween Year 3, 1995 <strong>and</strong> Year 5,1997. There continued to bevirtually no difference betweenboys <strong>and</strong> girls in BST numeracy.Complete details <strong>of</strong> theperformance <strong>of</strong> government schoolstudents in Basic Skills Tests <strong>and</strong>the School Certificate are providedin the section Monitoring StudentProgress later in this volume.Apparent retention rates for allstudents fell slightly between 1996<strong>and</strong> 1997. Rates for girls remainabout 11.5 percentage points higherthan for boys. More boys than girlscontinue their education throughthe TAFE system whileundertaking apprenticeships.Basic Skills Test Scores by GenderLiteracysGrowth8.2BoysNumeracysGrowth8.1BoysYear 5,1997Year 3,1995Year 5,1997Year 3,1995LiteracysGrowth7.8GirlsNumeracysGrowth7.8GirlsYear 5,1997Year 3,1995Year 5,1997Year 3,1995NOTE: These graphs show the amount <strong>of</strong>growth in numeracy <strong>and</strong> literacy in theBasic Skills Test for the 1997 Year cohortover the previous two years. The resultsare based on analysis <strong>of</strong> matched data pairs.DSE Annual Report 1997 85