01 - Department of Education and Communities - NSW Government
01 - Department of Education and Communities - NSW Government
01 - Department of Education and Communities - NSW Government

Create successful ePaper yourself
Turn your PDF publications into a flip-book with our unique Google optimized e-Paper software.
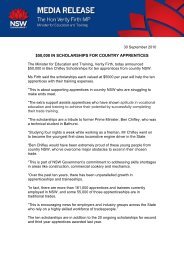
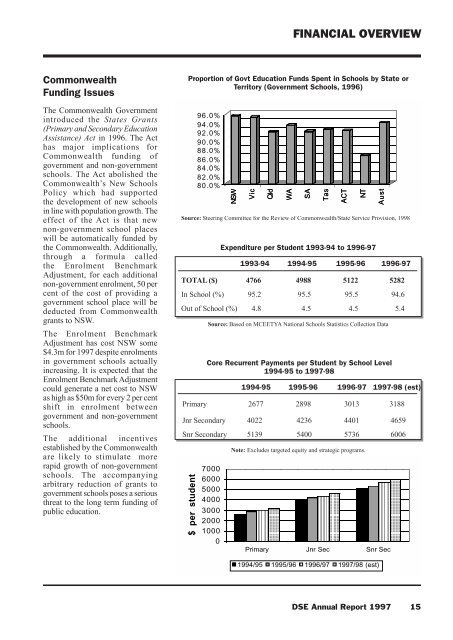
FINANCIAL OVERVIEWCommonwealthFunding IssuesThe Commonwealth <strong>Government</strong>introduced the States Grants(Primary <strong>and</strong> Secondary <strong>Education</strong>Assistance) Act in 1996. The Acthas major implications forCommonwealth funding <strong>of</strong>government <strong>and</strong> non-governmentschools. The Act abolished theCommonwealth’s New SchoolsPolicy which had supportedthe development <strong>of</strong> new schoolsin line with population growth. Theeffect <strong>of</strong> the Act is that newnon-government school placeswill be automatically funded bythe Commonwealth. Additionally,through a formula calledthe Enrolment BenchmarkAdjustment, for each additionalnon-government enrolment, 50 percent <strong>of</strong> the cost <strong>of</strong> providing agovernment school place will bededucted from Commonwealthgrants to <strong>NSW</strong>.The Enrolment BenchmarkAdjustment has cost <strong>NSW</strong> some$4.3m for 1997 despite enrolmentsin government schools actuallyincreasing. It is expected that theEnrolment Benchmark Adjustmentcould generate a net cost to <strong>NSW</strong>as high as $50m for every 2 per centshift in enrolment betweengovernment <strong>and</strong> non-governmentschools.The additional incentivesestablished by the Commonwealthare likely to stimulate morerapid growth <strong>of</strong> non-governmentschools. The accompanyingarbitrary reduction <strong>of</strong> grants togovernment schools poses a seriousthreat to the long term funding <strong>of</strong>public education.Proportion <strong>of</strong> Govt <strong>Education</strong> Funds Spent in Schools by State orTerritory (<strong>Government</strong> Schools, 1996)96.0%94.0%92.0%90.0%88.0%86.0%84.0%82.0%80.0%<strong>NSW</strong>VicQldWASource: Steering Committee for the Review <strong>of</strong> Commonwealth/State Service Provision, 1998Expenditure per Student 1993-94 to 1996-971993-94 1994-95 1995-96 1996-97TOTAL ($) 4766 4988 5122 5282In School (%) 95.2 95.5 95.5 94.6Out <strong>of</strong> School (%) 4.8 4.5 4.5 5.4Source: Based on MCEETYA National Schools Statistics Collection DataCore Recurrent Payments per Student by School Level1994-95 to 1997-981994-95 1995-96 1996-97 1997-98 (est)Primary 2677 2898 3<strong>01</strong>3 3188Jnr Secondary 4022 4236 44<strong>01</strong> 4659Snr Secondary 5139 5400 5736 6006$ per student70006000500040003000200<strong>01</strong>0000SATasACTNTNote: Excludes targeted equity <strong>and</strong> strategic programs.AustPrimary Jnr Sec Snr Sec1994/95 1995/96 1996/97 1997/98 (est)DSE Annual Report 1997 15