01 - Department of Education and Communities - NSW Government
01 - Department of Education and Communities - NSW Government
01 - Department of Education and Communities - NSW Government

Create successful ePaper yourself
Turn your PDF publications into a flip-book with our unique Google optimized e-Paper software.
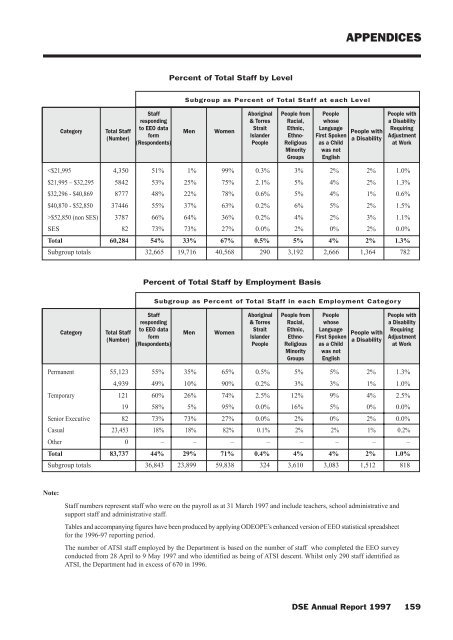
APPENDICESPercent <strong>of</strong> Total Staff by LevelSubgroup as Percent <strong>of</strong> Total Staff at each LevelCategoryTotal Staff(Number)Staffrespondingto EEO dataform(Respondents)MenWomenAboriginal& TorresStraitIsl<strong>and</strong>erPeoplePeople fromRacial,Ethnic,Ethno-ReligiousMinorityGroupsPeoplewhoseLanguageFirst Spokenas a Childwas notEnglishPeople witha DisabilityPeople witha DisabilityRequiringAdjustmentat Work$52,850 (non SES) 3787 66% 64% 36% 0.2% 4% 2% 3% 1.1%SES 82 73% 73% 27% 0.0% 2% 0% 2% 0.0%Total 60,284 54% 33% 67% 0.5% 5% 4% 2% 1.3%Subgroup totals 32,665 19,716 40,568 290 3,192 2,666 1,364 782Percent <strong>of</strong> Total Staff by Employment BasisSubgroup as Percent <strong>of</strong> Total Staff in each Employment CategoryCategoryTotal Staff(Number)Staffrespondingto EEO dataform(Respondents)MenWomenAboriginal& TorresStraitIsl<strong>and</strong>erPeoplePeople fromRacial,Ethnic,Ethno-ReligiousMinorityGroupsPeoplewhoseLanguageFirst Spokenas a Childwas notEnglishPeople witha DisabilityPeople witha DisabilityRequiringAdjustmentat WorkPermanent 55,123 55% 35% 65% 0.5% 5% 5% 2% 1.3%4,939 49% 10% 90% 0.2% 3% 3% 1% 1.0%Temporary 121 60% 26% 74% 2.5% 12% 9% 4% 2.5%19 58% 5% 95% 0.0% 16% 5% 0% 0.0%Senior Executive 82 73% 73% 27% 0.0% 2% 0% 2% 0.0%Casual 23,453 18% 18% 82% 0.1% 2% 2% 1% 0.2%Other 0 – – – – – – – –Total 83,737 44% 29% 71% 0.4% 4% 4% 2% 1.0%Subgroup totals 36,843 23,899 59,838 324 3,610 3,083 1,512 818Note:Staff numbers represent staff who were on the payroll as at 31 March 1997 <strong>and</strong> include teachers, school administrative <strong>and</strong>support staff <strong>and</strong> administrative staff.Tables <strong>and</strong> accompanying figures have been produced by applying ODEOPE’s enhanced version <strong>of</strong> EEO statistical spreadsheetfor the 1996-97 reporting period.The number <strong>of</strong> ATSI staff employed by the <strong>Department</strong> is based on the number <strong>of</strong> staff who completed the EEO surveyconducted from 28 April to 9 May 1997 <strong>and</strong> who identified as being <strong>of</strong> ATSI descent. Whilst only 290 staff identified asATSI, the <strong>Department</strong> had in excess <strong>of</strong> 670 in 1996.DSE Annual Report 1997 159