01 - Department of Education and Communities - NSW Government
01 - Department of Education and Communities - NSW Government
01 - Department of Education and Communities - NSW Government

You also want an ePaper? Increase the reach of your titles
YUMPU automatically turns print PDFs into web optimized ePapers that Google loves.
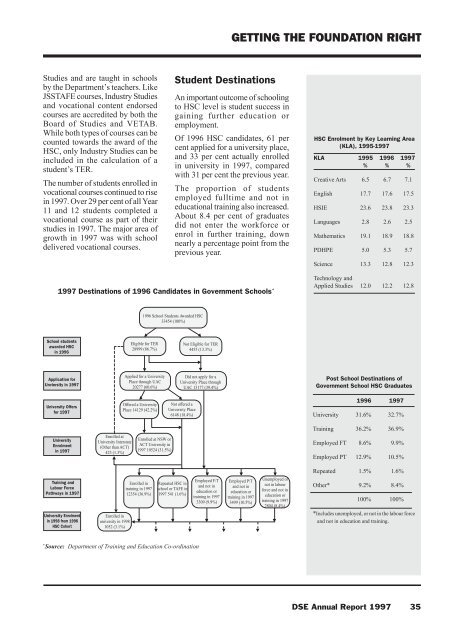
GETTING THE FOUNDATION RIGHTStudies <strong>and</strong> are taught in schoolsby the <strong>Department</strong>’s teachers. LikeJSSTAFE courses, Industry Studies<strong>and</strong> vocational content endorsedcourses are accredited by both theBoard <strong>of</strong> Studies <strong>and</strong> VETAB.While both types <strong>of</strong> courses can becounted towards the award <strong>of</strong> theHSC, only Industry Studies can beincluded in the calculation <strong>of</strong> astudent’s TER.The number <strong>of</strong> students enrolled invocational courses continued to risein 1997. Over 29 per cent <strong>of</strong> all Year11 <strong>and</strong> 12 students completed avocational course as part <strong>of</strong> theirstudies in 1997. The major area <strong>of</strong>growth in 1997 was with schooldelivered vocational courses.Student DestinationsAn important outcome <strong>of</strong> schoolingto HSC level is student success ingaining further education oremployment.Of 1996 HSC c<strong>and</strong>idates, 61 percent applied for a university place,<strong>and</strong> 33 per cent actually enrolledin university in 1997, comparedwith 31 per cent the previous year.The proportion <strong>of</strong> studentsemployed fulltime <strong>and</strong> not ineducational training also increased.About 8.4 per cent <strong>of</strong> graduatesdid not enter the workforce orenrol in further training, downnearly a percentage point from theprevious year.HSC Enrolment by Key Learning Area(KLA), 1995-1997KLA 1995 1996 1997% % %Creative Arts 6.5 6.7 7.1English 17.7 17.6 17.5HSIE 23.6 23.8 23.3Languages 2.8 2.6 2.5Mathematics 19.1 18.9 18.8PDHPE 5.0 5.3 5.7Science 13.3 12.8 12.31997 Destinations <strong>of</strong> 1996 C<strong>and</strong>idates in <strong>Government</strong> Schools *Technology <strong>and</strong>Applied Studies 12.0 12.2 12.81996 School Students Awarded HSC33454 (100%)School studentsawarded HSCin 1996▼Eligible for TER28999 (86.7%)▼Not Eligible for TER4455 (13.3%)▼Application forUnviersity in 1997▼Applied for a UniversityPlace through UAC20277 (60.6%)▼Did not apply for aUniversity Place throughUAC 13177 (39.4%)Post School Destinations <strong>of</strong><strong>Government</strong> School HSC GraduatesUniversity Offersfor 1997▼Offered a UniversityPlace 14129 (42.2%)▼Not <strong>of</strong>fered aUniversity Place6148 (18.4%)1996 1997University 31.6% 32.7%UniversityEnrolmentin 1997Training <strong>and</strong>Labour ForcePathways in 1997University Enrolmentin 1998 from 1996HSC CohortEnrolled atUniversity Interstate(Other than ACT)423 (1.3%)▼▼Enrolled inuniversity in 19981052 (3.1%)Enrolled at <strong>NSW</strong> orACT University in1997 10524 (31.5%)Enrolled intraining in 199712354 (36.9%)▼▼▼▼▼▼ ▼ ▼ ▼Repeated HSC inschool or TAFE in1997 541 (1.6%)Employed F/T<strong>and</strong> not ineducation ortraining in 19973309 (9.9%)Employed P/T<strong>and</strong> not ineducation ortraining in 19973499 (10.5%)▼ ▼ ▼ ▼Unemployed ornot in labourforce <strong>and</strong> not ineducation ortraining in 19972804 (8.4%)▼ ▼ ▼ ▼ ▼Training 36.2% 36.9%Employed FT 8.6% 9.9%Employed PT 12.9% 10.5%Repeated 1.5% 1.6%Other* 9.2% 8.4%100% 100%*Includes unemployed, or not in the labour force<strong>and</strong> not in education <strong>and</strong> training.*Source: <strong>Department</strong> <strong>of</strong> Training <strong>and</strong> <strong>Education</strong> Co-ordinationDSE Annual Report 1997 35