01 - Department of Education and Communities - NSW Government
01 - Department of Education and Communities - NSW Government
01 - Department of Education and Communities - NSW Government

You also want an ePaper? Increase the reach of your titles
YUMPU automatically turns print PDFs into web optimized ePapers that Google loves.
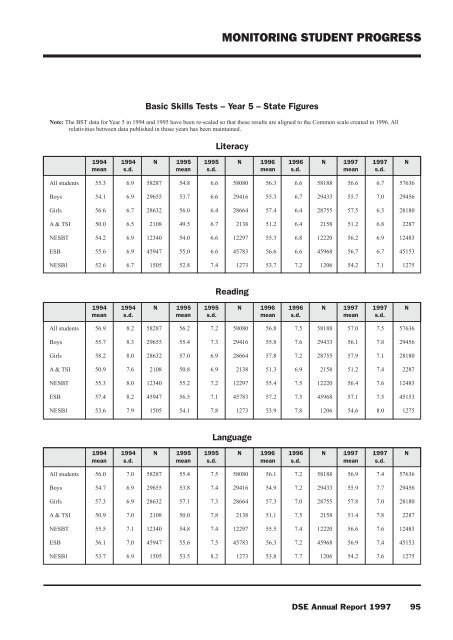
MONITORING STUDENT PROGRESSBasic Skills Tests – Year 5 – State FiguresNote: The BST data for Year 5 in 1994 <strong>and</strong> 1995 have been re-scaled so that these results are aligned to the Common scale created in 1996. Allrelativities between data published in those years has been maintained.Literacy1994 1994 N 1995 1995 N 1996 1996 N 1997 1997 Nmean s.d. mean s.d. mean s.d. mean s.d.All students 55.3 6.9 58287 54.8 6.6 58080 56.3 6.6 58188 56.6 6.7 57636Boys 54.1 6.9 29655 53.7 6.6 29416 55.3 6.7 29433 55.7 7.0 29456Girls 56.6 6.7 28632 56.0 6.4 28664 57.4 6.4 28755 57.5 6.3 28180A & TSI 50.0 6.5 2108 49.5 6.7 2138 51.2 6.4 2158 51.2 6.8 2287NESBT 54.2 6.9 12340 54.0 6.6 12297 55.3 6.8 12220 56.2 6.9 12483ESB 55.6 6.9 45947 55.0 6.6 45783 56.6 6.6 45968 56.7 6.7 45153NESB1 52.6 6.7 1505 52.8 7.4 1273 53.7 7.2 1206 54.2 7.1 1275Reading1994 1994 N 1995 1995 N 1996 1996 N 1997 1997 Nmean s.d. mean s.d. mean s.d. mean s.d.All students 56.9 8.2 58287 56.2 7.2 58080 56.8 7.5 58188 57.0 7.5 57636Boys 55.7 8.3 29655 55.4 7.3 29416 55.8 7.6 29433 56.1 7.8 29456Girls 58.2 8.0 28632 57.0 6.9 28664 57.8 7.2 28755 57.9 7.1 28180A & TSI 50.9 7.6 2108 50.8 6.9 2138 51.3 6.9 2158 51.2 7.4 2287NESBT 55.3 8.0 12340 55.2 7.2 12297 55.4 7.5 12220 56.4 7.6 12483ESB 57.4 8.2 45947 56.5 7.1 45783 57.2 7.5 45968 57.1 7.5 45153NESB1 53.6 7.9 1505 54.1 7.8 1273 53.9 7.8 1206 54.6 8.0 1275Language1994 1994 N 1995 1995 N 1996 1996 N 1997 1997 Nmean s.d. mean s.d. mean s.d. mean s.d.All students 56.0 7.0 58287 55.4 7.5 58080 56.1 7.2 58188 56.9 7.4 57636Boys 54.7 6.9 29655 53.8 7.4 29416 54.9 7.2 29433 55.9 7.7 29456Girls 57.3 6.9 28632 57.1 7.3 28664 57.3 7.0 28755 57.8 7.0 28180A & TSI 50.9 7.0 2108 50.0 7.8 2138 51.1 7.5 2158 51.4 7.8 2287NESBT 55.5 7.1 12340 54.8 7.4 12297 55.5 7.4 12220 56.6 7.6 12483ESB 56.1 7.0 45947 55.6 7.5 45783 56.3 7.2 45968 56.9 7.4 45153NESB1 53.7 6.9 1505 53.5 8.2 1273 53.8 7.7 1206 54.2 7.6 1275DSE Annual Report 1997 95