- Page 1: Decentralizationand local democracy
- Page 5 and 6: UCLG wishes to acknowledge the Supp
- Page 7 and 8: © 2008 United Cities and Local Gov
- Page 9 and 10: FOREWORD8 United Cities and Local G
- Page 11 and 12: PREFACE10 United Cities and Local G
- Page 13 and 14: EDITORIAL PROJECT12 United Cities a
- Page 15 and 16: ACKNOWLEDGMENTS14 United Cities and
- Page 17 and 18: ACKNOWLEDGMENTS16 United Cities and
- Page 19 and 20: INTRODUCTION18 United Cities and Lo
- Page 21 and 22: INTRODUCTION20 United Cities and Lo
- Page 24 and 25: AFRI C AMUSTAPHA BEN LETAIEFCHARLES
- Page 26 and 27: 23I. IntroductionAfrica encompasses
- Page 28 and 29: 25CCountry Political Type of state
- Page 30 and 31: 27and local governments are defined
- Page 32 and 33: 29torical context from which they e
- Page 34 and 35: 31aid. In some cases, central gover
- Page 36 and 37: 33suffrage. Metropolitan councillor
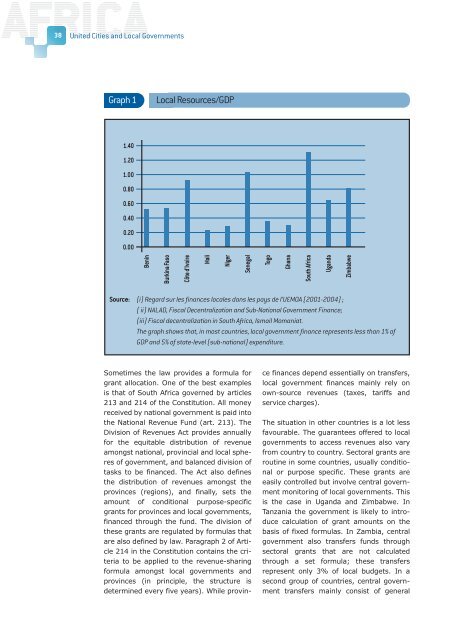
- Page 38 and 39: 35Table 3 Responsibilities of local
- Page 42 and 43: 39disbursements to local government
- Page 44 and 45: 41Table 4 Human resource situationC
- Page 46 and 47: 43Table 5 Portrait of local democra
- Page 48 and 49: 45view and approve executive bodies
- Page 50: 47V. ConclusionThis overall picture
- Page 53 and 54: ASIA-PACIFIC50 United Cities and Lo
- Page 55 and 56: ASIA-PACIFIC52United Cities and Loc
- Page 57 and 58: ASIA-PACIFIC54United Cities and Loc
- Page 59 and 60: ASIA-PACIFIC56United Cities and Loc
- Page 61 and 62: ASIA-PACIFIC58United Cities and Loc
- Page 63 and 64: ASIA-PACIFIC60 United Cities and Lo
- Page 65 and 66: ASIA-PACIFIC62United Cities and Loc
- Page 67 and 68: ASIA-PACIFIC64United Cities and Loc
- Page 69 and 70: ASIA-PACIFIC66 United Cities and Lo
- Page 71 and 72: ASIA-PACIFIC68United Cities and Loc
- Page 73 and 74: ASIA-PACIFIC70United Cities and Loc
- Page 75 and 76: ASIA-PACIFIC72 United Cities and Lo
- Page 77 and 78: ASIA-PACIFIC74United Cities and Loc
- Page 79 and 80: ASIA-PACIFIC76United Cities and Loc
- Page 81 and 82: ASIA-PACIFIC78United Cities and Loc
- Page 83 and 84: ASIA-PACIFIC80United Cities and Loc
- Page 85 and 86: ASIA-PACIFIC82United Cities and Loc
- Page 87 and 88: ASIA-PACIFIC84United Cities and Loc
- Page 89 and 90: ASIA-PACIFIC86United Cities and Loc
- Page 91 and 92:
ASIA-PACIFIC88United Cities and Loc
- Page 93 and 94:
ASIA-PACIFIC90 United Cities and Lo
- Page 96 and 97:
EURASIAT. Y. K HABRIE VA(C HIEF RES
- Page 98 and 99:
95I. IntroductionThis chapter analy
- Page 100 and 101:
97Table 1General Information and Te
- Page 102 and 103:
99The constitutions of several stat
- Page 104 and 105:
101vote. Rather, control of local m
- Page 106 and 107:
103Capitals and Metropolitan AreasT
- Page 108 and 109:
105losing their local, own sources
- Page 110 and 111:
107Table 3Local Finance Indicators
- Page 112 and 113:
109Education. In the majority of st
- Page 114 and 115:
111Table 4Functions of Local Govern
- Page 116 and 117:
113execution of their duties munici
- Page 118 and 119:
115State Formation of local Local e
- Page 120 and 121:
117State Formation of local Local e
- Page 122 and 123:
119On the whole, local elections in
- Page 124 and 125:
121neighborhood, part of a resident
- Page 126 and 127:
123corporate) persons may be resolv
- Page 128:
125fragile, in part due to complica
- Page 131 and 132:
EUROPE128 United Cities and Local G
- Page 133 and 134:
EUROPE130United Cities and Local Go
- Page 135 and 136:
EUROPE132United Cities and Local Go
- Page 137 and 138:
EUROPE134 United Cities and Local G
- Page 139 and 140:
EUROPE136United Cities and Local Go
- Page 141 and 142:
EUROPE138United Cities and Local Go
- Page 143 and 144:
EUROPE140United Cities and Local Go
- Page 145 and 146:
EUROPE142United Cities and Local Go
- Page 147 and 148:
EUROPE144United Cities and Local Go
- Page 149 and 150:
EUROPE146United Cities and Local Go
- Page 151 and 152:
EUROPE148United Cities and Local Go
- Page 153 and 154:
EUROPE150United Cities and Local Go
- Page 155 and 156:
EUROPE152United Cities and Local Go
- Page 157 and 158:
EUROPE154United Cities and Local Go
- Page 159 and 160:
EUROPE156United Cities and Local Go
- Page 161 and 162:
EUROPE158United Cities and Local Go
- Page 163 and 164:
EUROPE160United Cities and Local Go
- Page 165 and 166:
EUROPE162United Cities and Local Go
- Page 167 and 168:
EUROPE164United Cities and Local Go
- Page 170 and 171:
L ATIN AMERICAMARI O ROS ALESSALVAD
- Page 172 and 173:
167I. IntroductionLatin America is
- Page 174 and 175:
169Nevertheless, the depth of the r
- Page 176 and 177:
171America (see graph 1). The feder
- Page 178 and 179:
173initially appointed by the natio
- Page 180 and 181:
175nicipal (Municipal Budget Regime
- Page 182 and 183:
177and generate significant demogra
- Page 184 and 185:
179Table 3Evolution and Distributio
- Page 186 and 187:
181where it is the responsibility o
- Page 188 and 189:
183BoxTransfer Systems in Latin Ame
- Page 190 and 191:
185tection was organized for the un
- Page 192 and 193:
187Table 4 Municipal responsibiliti
- Page 194 and 195:
189percentage of houses connected t
- Page 196 and 197:
191partments or regions held electi
- Page 198 and 199:
193cipation funds. The oversight co
- Page 200 and 201:
195Table 6Associations of Municipal
- Page 202 and 203:
197about renewal of leadership and
- Page 204:
199Despite advancesin decentralizat
- Page 207 and 208:
MIDDLE EAST / WESTERN ASIA202 Unite
- Page 209 and 210:
MIDDLE EAST / WESTERN ASIA204United
- Page 211 and 212:
MIDDLE EAST / WESTERN ASIA206United
- Page 213 and 214:
MIDDLE EAST / WESTERN ASIA208United
- Page 215 and 216:
MIDDLE EAST / WESTERN ASIA210United
- Page 217 and 218:
MIDDLE EAST / WESTERN ASIA212United
- Page 219 and 220:
MIDDLE EAST / WESTERN ASIA214United
- Page 221 and 222:
MIDDLE EAST / WESTERN ASIA216United
- Page 223 and 224:
MIDDLE EAST / WESTERN ASIA218United
- Page 225 and 226:
MIDDLE EAST / WESTERN ASIA220United
- Page 227 and 228:
MIDDLE EAST / WESTERN ASIA222 Unite
- Page 229 and 230:
MIDDLE EAST / WESTERN ASIA224United
- Page 231 and 232:
MIDDLE EAST / WESTERN ASIA226United
- Page 233 and 234:
MIDDLE EAST / WESTERN ASIA228 Unite
- Page 236 and 237:
NORTH AMERICA(CANADA AND THE UNITED
- Page 238 and 239:
233I. IntroductionThis chapter comp
- Page 240 and 241:
235Table 1Governmental and Country
- Page 242 and 243:
237Decentralization has attracted t
- Page 244 and 245:
239preparedness and security. Even
- Page 246 and 247:
241years, however, local government
- Page 248 and 249:
243reflect the consequences of syst
- Page 250 and 251:
245years. In the U.S. there are oft
- Page 252 and 253:
247tion of Canadian Municipalities
- Page 254 and 255:
249One of the most important roles
- Page 256:
251V. ConclusionIn both Canada and
- Page 259 and 260:
METROPOLITAN GOVERNANCE254 United C
- Page 261 and 262:
METROPOLITAN GOVERNANCE256United Ci
- Page 263 and 264:
METROPOLITAN GOVERNANCE258United Ci
- Page 265 and 266:
METROPOLITAN GOVERNANCE260United Ci
- Page 267 and 268:
METROPOLITAN GOVERNANCE262United Ci
- Page 269 and 270:
METROPOLITAN GOVERNANCE264United Ci
- Page 271 and 272:
METROPOLITAN GOVERNANCE266United Ci
- Page 273 and 274:
METROPOLITAN GOVERNANCE268United Ci
- Page 275 and 276:
METROPOLITAN GOVERNANCE270United Ci
- Page 277 and 278:
METROPOLITAN GOVERNANCE272United Ci
- Page 279 and 280:
METROPOLITAN GOVERNANCE274United Ci
- Page 281 and 282:
METROPOLITAN GOVERNANCE276United Ci
- Page 283 and 284:
METROPOLITAN GOVERNANCE278 United C
- Page 285 and 286:
CONCLUSION280 United Cities and Loc
- Page 287 and 288:
CONCLUSION282 United Cities and Loc
- Page 289 and 290:
CONCLUSION284 United Cities and Loc
- Page 291 and 292:
CONCLUSION286 United Cities and Loc
- Page 293 and 294:
CONCLUSION288 United Cities and Loc
- Page 295 and 296:
CONCLUSION290 United Cities and Loc
- Page 297 and 298:
CONCLUSION292 United Cities and Loc
- Page 299 and 300:
CONCLUSION294 United Cities and Loc
- Page 301 and 302:
CONCLUSION296 United Cities and Loc
- Page 303 and 304:
CONCLUSION298 United Cities and Loc
- Page 305 and 306:
CONCLUSION300 United Cities and Loc
- Page 307 and 308:
CONCLUSION302 United Cities and Loc
- Page 309 and 310:
POSTFACE304 United Cities and Local
- Page 311 and 312:
POSTFACE306 United Cities and Local
- Page 313 and 314:
POSTFACE308 United Cities and Local
- Page 315 and 316:
POSTFACE310 United Cities and Local
- Page 317 and 318:
POSTFACE312 United Cities and Local
- Page 320 and 321:
BIBLIOGRAPHY
- Page 322 and 323:
317AfricaBanque Mondiale, 2003, Ré
- Page 324 and 325:
319International Monetary Fund, 200
- Page 326 and 327:
321EurasiaAdministrativnaya reforma
- Page 328 and 329:
323Regulirovanie voprosov organizac
- Page 330 and 331:
325Guérin-Lavignotte, E., Kerrouch
- Page 332 and 333:
327--- Descentralización, transfer
- Page 334 and 335:
329Middle East and West AsiaUnited
- Page 336 and 337:
331North AmericaSaudi Ministry of R
- Page 338 and 339:
333Laubach, T., 2005, Fiscal Relati
- Page 340 and 341:
335Metropolitan GovernanceU.S. Bure
- Page 342 and 343:
337Kübler, D., 2005, Problems and
- Page 344 and 345:
339ConclusionAalborg C., 1994, Char
- Page 346:
341Rothblatt, D. N. and Sancton A.