- Page 5 and 6: Newcastle City Council - Highway As
- Page 7 and 8: Newcastle City Council - Highway As
- Page 9 and 10: Newcastle City Council - Highway As
- Page 11 and 12: Newcastle City Council - Highway As
- Page 13 and 14: Executive Summary0.2 Goals and obje
- Page 15 and 16: Executive SummaryTable 0.2 - Overal
- Page 17 and 18: Executive SummaryThe Levels of Serv
- Page 19 and 20: Executive SummaryTable 0.3 - Highwa
- Page 21 and 22: Executive Summary0.9 Performance Ga
- Page 23 and 24: Introduction1.0 Introduction1.1 Def
- Page 25 and 26: IntroductionTo ensure that the HAMP
- Page 27 and 28: Goals, Objectives & Policies3.0 Goa
- Page 29 and 30: Inventory & Condition Assessment4.0
- Page 31 and 32: Levels of Service• Transport Act
- Page 33 and 34: Levels of Service5.2.2 PavementsThe
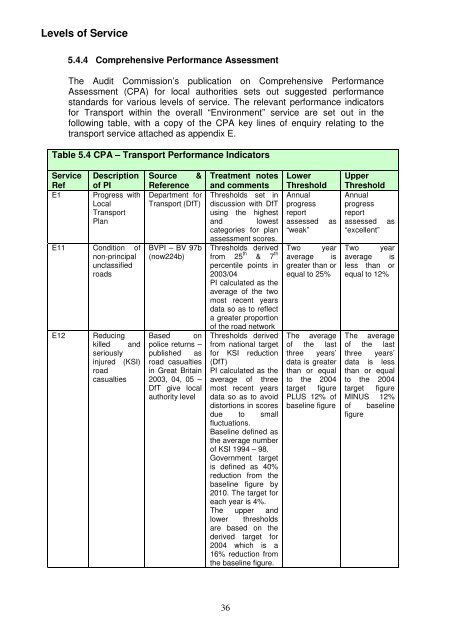
- Page 35 and 36: Levels of Service• In each of the
- Page 37: Levels of Serviceinvestment, leadin
- Page 41 and 42: Levels of Service• Financial cons
- Page 43 and 44: Levels of ServiceTable 5.1 Service
- Page 45 and 46: Levels of ServiceTable 5.1 Service
- Page 47 and 48: Lifecycle Option Appraisalmaintenan
- Page 49 and 50: Decision Makingcomplicated procedur
- Page 51 and 52: Risk AssessmentThe table below prov
- Page 53 and 54: Forward Works Programme9.0 Forward
- Page 55 and 56: Performance Measurement11.0 Perform
- Page 57 and 58: Asset Information Strategy13.0 Asse
- Page 59 and 60: Asset Information StrategyInformati
- Page 61 and 62: Asset Information StrategyTable 13.
- Page 63 and 64: Asset Information StrategyTable 13.
- Page 65 and 66: Asset Information Strategy13.3.3 Up
- Page 67: Asset Information StrategyThe infor
- Page 71 and 72: Asset Information StrategyTable 13.
- Page 74 and 75: Asset Information Strategy13.5 Brid
- Page 76 and 77: Asset Information Strategy13.5.2 Re
- Page 78 and 79: Asset Information StrategyTable 13.
- Page 80 and 81: Asset Information Strategybudget re
- Page 84 and 85: Asset Information StrategyTable 13.
- Page 86 and 87: Asset Information StrategyLocationT
- Page 88 and 89:
Asset Information StrategyTable 13.
- Page 90:
Asset Information StrategyThe infor
- Page 93 and 94:
Asset Information Strategy13.8 Stre
- Page 95 and 96:
Carriageways Life Cycle Plan• Ins
- Page 97 and 98:
Carriageways Life Cycle PlanAlthoug
- Page 99 and 100:
Carriageways Life Cycle PlanTable 1
- Page 101 and 102:
Carriageways Life Cycle PlanTable 1
- Page 103 and 104:
Carriageways Life Cycle PlanFigure
- Page 105 and 106:
Carriageways Life Cycle PlanTable 1
- Page 107 and 108:
Carriageways Life Cycle PlanTable 1
- Page 109 and 110:
Carriageways Life Cycle PlanTable 1
- Page 111 and 112:
Carriageways Life Cycle PlanTable 1
- Page 113 and 114:
Carriageways Life Cycle Plan14.7.4
- Page 115 and 116:
Carriageways Life Cycle Plan14.8.2
- Page 117 and 118:
Carriageways Life Cycle Planformall
- Page 119 and 120:
Carriageways Life Cycle PlanTable 1
- Page 121 and 122:
Footways & Cycleways Life Cycle Pla
- Page 123 and 124:
Footways & Cycleways Life Cycle Pla
- Page 125 and 126:
Footways & Cycleways Life Cycle Pla
- Page 127 and 128:
Footways & Cycleways Life Cycle Pla
- Page 129 and 130:
Footways & Cycleways Life Cycle Pla
- Page 131 and 132:
Footways & Cycleways Life Cycle Pla
- Page 133 and 134:
Footways & Cycleways Life Cycle Pla
- Page 135 and 136:
Footways & Cycleways Life Cycle Pla
- Page 137 and 138:
Footways & Cycleways Life Cycle Pla
- Page 139 and 140:
Footways & Cycleways Life Cycle Pla
- Page 141 and 142:
Highway Green Spaces Life Cycle Pla
- Page 143 and 144:
Highway Green Spaces Life Cycle Pla
- Page 145 and 146:
Highway Green Spaces Life Cycle Pla
- Page 147 and 148:
Highway Green Spaces Life Cycle Pla
- Page 149 and 150:
Highway Green Spaces Life Cycle Pla
- Page 151 and 152:
Highway Green Spaces Life Cycle Pla
- Page 153 and 154:
Highway Green Spaces Life Cycle Pla
- Page 155 and 156:
Bridges and Other Highway Structure
- Page 157 and 158:
Bridges and Other Highway Structure
- Page 159 and 160:
Bridges and Other Highway Structure
- Page 161 and 162:
Bridges and Other Highway Structure
- Page 163 and 164:
Bridges and Other Highway Structure
- Page 165 and 166:
Bridges and Other Highway Structure
- Page 167 and 168:
Bridges and Other Highway Structure
- Page 169 and 170:
Bridges and Other Highway Structure
- Page 171 and 172:
Bridges and Other Highway Structure
- Page 173 and 174:
Bridges and Other Highway Structure
- Page 175 and 176:
Bridges and Other Highway Structure
- Page 177 and 178:
Traffic Signals Life Cycle Plan18.0
- Page 179 and 180:
Traffic Signals Life Cycle PlanTabl
- Page 181 and 182:
Traffic Signals Life Cycle Plan18.5
- Page 183 and 184:
Traffic Signals Life Cycle PlanTabl
- Page 185 and 186:
Traffic Signals Life Cycle PlanTabl
- Page 187 and 188:
Traffic Signals Life Cycle PlanTabl
- Page 189 and 190:
Traffic Signals Life Cycle Plan♦
- Page 191 and 192:
Traffic Signals Life Cycle Planshou
- Page 193 and 194:
Traffic Signals Life Cycle Plan•
- Page 195 and 196:
Street Lighting Life Cycle Plan•
- Page 197 and 198:
Street Lighting Life Cycle PlanTabl
- Page 199 and 200:
Street Lighting Life Cycle Plan19.6
- Page 201 and 202:
Street Lighting Life Cycle PlanTabl
- Page 203 and 204:
Street Lighting Life Cycle Plan♦
- Page 205 and 206:
Street Lighting Life Cycle PlanBVPI
- Page 207 and 208:
Signs, Barriers & Street Furniture
- Page 209 and 210:
Signs, Barriers & Street Furniture
- Page 211 and 212:
Signs, Barriers & Street Furniture
- Page 213 and 214:
Signs, Barriers & Street Furniture
- Page 215 and 216:
Signs, Barriers & Street Furniture
- Page 217 and 218:
Signs, Barriers & Street Furniture
- Page 219 and 220:
Winter Maintenance Life Cycle PlanP
- Page 221 and 222:
Winter Maintenance Life Cycle PlanT
- Page 223 and 224:
Winter Maintenance Life Cycle PlanT
- Page 225 and 226:
Winter Maintenance Life Cycle PlanN
- Page 227:
Conclusions and Recommendations22.0