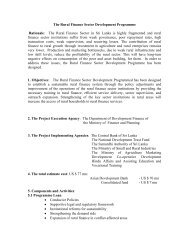
Special meetings have been organizedunder the patronage <strong>of</strong> the Hon. Minister<strong>of</strong> Economic Development, Mr. BasilRajapaksa, for plan <strong>2010</strong>/11 Mahaseason, with special attention torevitalizing the agriculture sector in theNorthern <strong>and</strong> Eastern ProvincesThe <strong>of</strong>ficers in the Department <strong>of</strong>National <strong>Planning</strong> attended the Steeringcommittee meeting<strong>of</strong> the Dry ZoneLivelihood Support <strong>and</strong> PartnershipProgramme <strong>and</strong> Enhancing FoodSecurity <strong>and</strong> Nutrition among the mostvulnerable farm families in Eastern SriLanka. In addition, <strong>of</strong>ficers haveparticipated in progress review meetings<strong>and</strong> Policy review meetings.Fisheries <strong>and</strong> Aquatic ResourcesThe development <strong>of</strong> the fisheries sector hasbeen given strategic importance in thenational development plan <strong>of</strong> the country.The fisheries sector development plan wasintroduced. In terms <strong>of</strong> construction, thecentral fish market at Peliyagodacommenced in <strong>2010</strong> at a cost <strong>of</strong> Rs. 7.9 bn.Construction <strong>of</strong> a number <strong>of</strong> fishingharbours, anchorages <strong>and</strong> l<strong>and</strong>ing sites atstrategic places are in progress. The totalinvestment is estimated around Rs 2,000 mn.The total contribution <strong>of</strong> the fisheries sectorto the GDP was 1.5 percent in <strong>2010</strong> <strong>and</strong> theoutput <strong>of</strong> the sector has increased by 13percent in <strong>2010</strong> compared with year 2009.The marine <strong>and</strong> inl<strong>and</strong> fish production hasincreased by 13 percent <strong>and</strong> 12.5 percentrespectively in <strong>2010</strong> compared withproduction in 2009. The fisheries sector hasshown a steady growth after the tsunami.This is as a result <strong>of</strong> the policy initiatives<strong>and</strong> considerable investment <strong>of</strong> the sector forthe development <strong>of</strong> <strong>of</strong>f shore, inl<strong>and</strong> <strong>and</strong>aquaculture sectors.The composition <strong>of</strong> the marine fleet willundergo a slight variation with the absolutenumber <strong>of</strong> <strong>of</strong>fshore/deep sea <strong>and</strong> high seasvessels increasing by 838 i.e. by 34 percentover the ten year period while the coastalvessels will increase only by 698 i.e. by lessthan 2 percent.The contribution <strong>of</strong> the high seas/<strong>of</strong>fshoresub-sector in terms <strong>of</strong> volume will increasefrom 95,995 metric tons to 183,020 metrictons i.e. by 90 percent over the ten yearperiod while the production in the coastalsector will increase by nearly 114,000 metrictons. This apparent high increase is due tothe very adverse impact <strong>of</strong> the tsunamiwhich dragged down coastal fish productionto very low ebb in the two years <strong>of</strong> 2005-2006. This ten year target for coastal fishproduction is in line with the resourcelimitations in the coastal sub-sector.Sri Lanka possesses suitable <strong>and</strong> abundantwater <strong>and</strong> l<strong>and</strong> resources for thedevelopment <strong>of</strong> a viable inl<strong>and</strong> fishing <strong>and</strong>aquaculture industry. After a setback in theearly 1990s, this sub-sector has beenrejuvenated with the re-establishment <strong>of</strong> theInl<strong>and</strong> Fisheries Division (1994) <strong>and</strong> thesetting up <strong>of</strong> the National AquacultureDevelopment Authority (1999).Table 2 National Fish Production(Metric tons)YearCoastalSeasOffshore/ High&aquacultureInl<strong>and</strong>Fish:2004 154,470 98,720 33,1802006 121,350 95,999 36,5302007 224,320 123,950 40,9002012 228,482 153,000 55,7002016 236,132 183,020 74,450146
Aquatic Resources Development <strong>and</strong>Quality Improvement Project (ARDQIP) hasbeen supporting NAQDA in developingfresh water capture fisheries <strong>and</strong> aquacultureup to 2009.Main interventions <strong>of</strong> this project directlyimpacting on production increases are inculture based fisheries in minor reservoirs<strong>and</strong> seasonal tanks <strong>and</strong> fish seed production.Through the implementation <strong>of</strong> theseactivities, the total carp <strong>and</strong> tilapiaproduction <strong>of</strong> all enterprises will increase upto 45,223 metric tons at full development <strong>of</strong>the ARDQIP by the year 2009. On thisbasis, the volume <strong>of</strong> inl<strong>and</strong> <strong>and</strong> aquaculturefish production will be more than doubleover that <strong>of</strong> the base year (35,200 metrictons in 2006) up to 74,500 metric tons by2016).YearTable 3-Fleet Composition, projections <strong>of</strong> marine sub-sector production - 2004-<strong>2010</strong>HighSeasBoatsMultidayBoatsOneDayBoatsOutBoard 6-8m FRPMotorizedTrad:boatsNon-Mot:TraditionalBoatsBeachSeineBoatsTotalMarineProduction2004No. <strong>of</strong> Boats - 1581 1,493 11,559 674 15,260 900Catch (Mt.) -- 98,720 29,190 82,070 2,140 24,400 16,668 253,1882006No. <strong>of</strong> Boats 11 2,394 907 16,685 1,842 15,714 633Catch 1,375 94,620 13,390 65,640 6,860 25,220 10,240 217,3492007No. <strong>of</strong> Boats 10 2,454 1,085 15,016 2,188 16,000 990Catch 1,250 122,700 19,530 135,144 9,846 40,000 19,800 348,2702008No. <strong>of</strong> Boats 13 2,529 1,110 15,016 2,213 16,000 990Catch 2,000 126,450 19,980 135,144 9,958 40,000 19,800 353,3322009No. <strong>of</strong> Boats 19 2,604 1,135 15,016 2,238 16,000 990Catch 3,375 130,200 20,430 135144 10,071 40,000 19,800 359,020<strong>2010</strong>No. <strong>of</strong> Boats 26 2,679 1,160 15,016 2263 16,000 990Catch 5,125 133,950 20,880 135,444 10,183 40,000 19,800 365,082Table 4 - Annual Fish Production by Fishing Sub Sector (in Metric Tons)Marine Fish CatchTotal Inl<strong>and</strong> <strong>and</strong> Total FishYearOff shore/CoastalMarine Aquaculture ProductionDeep SeaFish forDry orSmoking2007 150,110 102,560 252,670 38,380 291,050 77,8302008 165,320 109,310 274,630 44,490 319,120 93,2402009 180,410 112,760 293,170 46,560 339,730 97,690<strong>2010</strong> 202,420 129,840 332,260 52,410 384,670 100,120Source: Statistics Unit, <strong>Ministry</strong> <strong>of</strong> Fisheries <strong>and</strong> Aquatic Resources Development147
- Page 1:
කාර්යසාධන වා
- Page 5 and 6:
3. 2010 වසෙර් ප්ර
- Page 8 and 9:
wod, f¾Çh wud;HdxY u`.ska bÈßm;
- Page 10 and 11:
j.+j 03cd;sl l%uiïmdok fomd¾;fïk
- Page 12 and 13:
mY= iïm;a wxYhmY= iïm;a wxYh Y%S
- Page 14 and 15:
wdjrKh lrhs' ñka ishhg 70 l muK ù
- Page 16 and 17:
Zoehg lsre
- Page 18 and 19:
miq.sh ld, jljdkqj ;=, fmd,aj.djg n
- Page 20 and 21:
;eme,a wxYfhys Wmdhud¾.sl m%uQL;d-
- Page 22 and 23:
ksu flfrkq we;' wêfõ.S ud¾. f.dv
- Page 24 and 25:
fuu jHdmD;s u`.ska wmc, neyer lsÍf
- Page 26 and 27:
Y%S ,xldfõ kd.ßlrKfha idudkH fõ.
- Page 28 and 29:
y; olajd we;s wNsfhda. ch .ekSu i|y
- Page 30 and 31:
j.=j - 23Wmdhud¾.sl rduqjúIh uQ,s
- Page 32 and 33:
j.=j 25 - l,dmSh ;r`.ldÍ o¾Yl^rgj
- Page 34 and 35:
j.=j 29Wiia wOHdmk myiqlïúia;rh 2
- Page 36 and 37:
f¾Çh wud;HdxY u.ska bÈßm;a lrk,
- Page 38 and 39:
j.=j 33 - ld¾ñl wOHdmkh yd ksmqK;
- Page 40 and 41:
lrñka w,s ñksia iyÔjkh j¾Okh ls
- Page 42 and 43:
wkd.; l%fudamdhhka1. m%Odk fndajk f
- Page 44 and 45:
frda.S f.dvke.s,a,ixj¾OkhW;=re m
- Page 46 and 47:
wod, wxYh fjkqfjka idlÉcd 09 lawdr
- Page 48 and 49:
ixpdrl lghq;=oekg Y%S ,xld wd¾Ólf
- Page 50 and 51:
uqyqÿ je,s Ndú;h m%p,s; lsÍu ioy
- Page 52 and 53:
සෙනාධාර වලින
- Page 54 and 55:
5. ාරිාාලන ඒකක
- Page 56 and 57:
(11) මක්.ජී.එස්.
- Page 58 and 59:
මාංා නමස තනුව
- Page 60 and 61:
මාංා නමස තනුව
- Page 62 and 63:
5.8 වගුව 50- 2010.12.31 ද
- Page 64 and 65:
nrayhw;W mwpf;if -2010Njrpa jpl;lkp
- Page 66 and 67:
02. jpizf;fsj;jpd; Jiwfs; kw;Wk; gp
- Page 68 and 69:
3.2 Jiwthupahd nrayhw;Wif3.2.1 Jiwt
- Page 70 and 71:
ml;ltiz 3.2.2 kPd;gpb cgJiwapd; tUl
- Page 72 and 73:
mjpfupj;Js;sJld; nfhOk;G> fk;g`hkw;
- Page 74 and 75:
Kd; nkhopag;gl;Ls;smjp Ntfg; ghijfs
- Page 76 and 77:
Mfhak; gpuahzpfspd; efHT (2016 ,y;
- Page 78 and 79:
ehl;by; fhzg;gLk; nkl;Nuh efuq;fs;k
- Page 80 and 81:
Vw;wj;jho;it Fiwj;J rkj;Jtkhdfy;tpi
- Page 82 and 83:
guhkup;j;jy; vd;gd vkJ fy;tpj;Jiwah
- Page 84 and 85:
,yq;if gy;fiyf;fofq;fspd;nrayhw;Wif
- Page 86 and 87:
gapw;rpaspg;gjD}lhf,f;FiwghldJeptHj
- Page 88 and 89:
ml;ltiz 3.2.19 epWtf ,aysTitj;jparh
- Page 90 and 91:
Jiwapd; gq;fspg;Gld; murhq;fkhdJmid
- Page 92 and 93:
ml;ltiz 3.2.21 ,yq;ifapd; fhzpg;ght
- Page 94 and 95:
Ntz;Lk;. tpahghuq;fs; kw;Wk;ifj;njh
- Page 96 and 97: 1. Aj;jj;jpdhy; ghjpf;fg;gl;lgpuNjr
- Page 98 and 99: kPd;gpb kw;Wk; ePupay; tsj;JiwngWNg
- Page 100 and 101: nghwpKiw czT Miyfs; kw;Wk;,iwr;rp g
- Page 102 and 103: uk;Gf;fd;jpl;lk;Xahmk;ghiw2000 n`.
- Page 104 and 105: 2010 Mk; Mz;by; mKy;gLj;jg;gl;lrf;j
- Page 106 and 107: %yk; ehd;F kpy;ypad; khztHfs;ed;ik
- Page 108 and 109: mjpfkhd khztHfSf;F gy;fiyf;fof mDkj
- Page 112: fhtp vr;.v];.v];jpl;lk; 2008-2012rj
- Page 116 and 117: xf;fk;gpahtpy; mike;Js;smurhq;fj;jp
- Page 118 and 119: 05 aho; kPdtr%fj;jpd;ngz;fsplj;jpy;
- Page 120 and 121: kfhtyp KiwikgP (tyJfiu)mgptpUj;jpj;
- Page 122 and 123: 100 rjtPjkhFk;. ehl;by; fhzg;gLk; 2
- Page 124 and 125: jghy;j;Jiwapd;cghaq;fs;Kd;Dupikg;gL
- Page 126 and 127: ml;ltiz 3.2.46JiwmDkjpf;fhfrkHg;gpf
- Page 128 and 129: ml;ltiz 3.2.48mDkjpaspf;fg;gl;l Nti
- Page 130 and 131: fye;jhNyhrpf;f 10 $l;lq;fspy;gpujpe
- Page 132 and 133: 5. kdpj ts mgptpUj;jp kw;Wk; nghJep
- Page 134 and 135: ngaH gjtp ehL ghlnewp fhyk; 2010rpy
- Page 136 and 137: No. ngaH gjtp ghlnewp fhyk;tiu.06 j
- Page 138 and 139: hujp I 14 14 00mYtyf cjtpahsH 15 15
- Page 140 and 141: CONTENTSPages1 Vision, Mission, Fun
- Page 142 and 143: 02. Divisions and the Sectors of th
- Page 144 and 145: 3.2. Sector-wise PerformanceEach de
- Page 148 and 149: The fisheries sector has emerged as
- Page 150 and 151: In 2010, institutions under the liv
- Page 152 and 153: Table 9 - Action Matrix for irrigat
- Page 154 and 155: The Department of National Planning
- Page 156 and 157: the development of electricity gene
- Page 158 and 159: RoadsRoads are the dominant mode of
- Page 160 and 161: During the 2005-2010 period five ma
- Page 162 and 163: Committee (SCARC) for furtherconsid
- Page 164 and 165: Housing and Urban DevelopmentUrban
- Page 166 and 167: The future cities will provide a hi
- Page 168 and 169: The following is a summary of the t
- Page 170 and 171: Table 28-Strategic Framework of the
- Page 172 and 173: Rs. Bn Increasing the quality of ed
- Page 174 and 175: Table 33 Education Projects Recomme
- Page 176 and 177: Institutions in 2010. However, at p
- Page 178 and 179: for establishing a close link betwe
- Page 180 and 181: citizen of the country and to progr
- Page 182 and 183: Table 43 Manpower in Health SectorC
- Page 184 and 185: health care delivery models to meet
- Page 186 and 187: Hambantota. The proposed stadium wa
- Page 188 and 189: The economic policy strategy of the
- Page 190 and 191: From 2007 onwards, attention has be
- Page 192 and 193: A monthly allowance of Rs. 3,000 is
- Page 194 and 195: Participated in the SLISTINETNetwor
- Page 196 and 197:
No. Name Post(28) Mrs. M.A.G. Thush
- Page 198 and 199:
(8) Mr. W.A. Anurudha Weerasooriya
- Page 200 and 201:
No Name Designation Country Name of
- Page 202 and 203:
No. Name Designation Name of the Co
- Page 204:
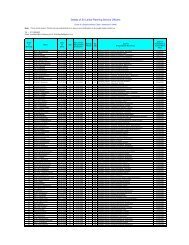
7 Project- - 44,500,000.00 15,705,8